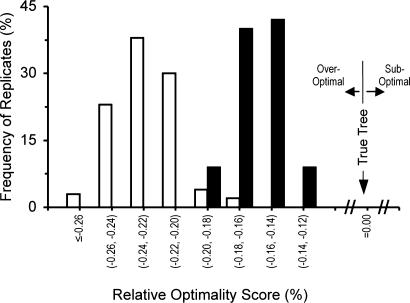
Fig. 6.
Distribution of relative optimality scores (R) of NJ-SE trees (filled bars) and NJ-IE trees (open bars) when a type B model tree (Fig. 2B) with 4,096 sequences is used. R is defined as (SNJ – ST)/ST, where SNJ and ST are the sum of all branch lengths for a NJ tree and the true tree, respectively (32). Therefore, when a NJ tree is the same as the true tree, R is 0. The sum (SNJ) of branch lengths of a NJ tree is often smaller than that of the true tree when the number of sequences is large, and R is usually negative. However, in general, the R values for NJ-SE trees are closer to 0 (R value for the true tree) than those for NJ-IE trees are. In this simulation the TN model with k1 = k2 = 4, gA = gT = gC = gG = 0.25, and n = 1,000 was used.

