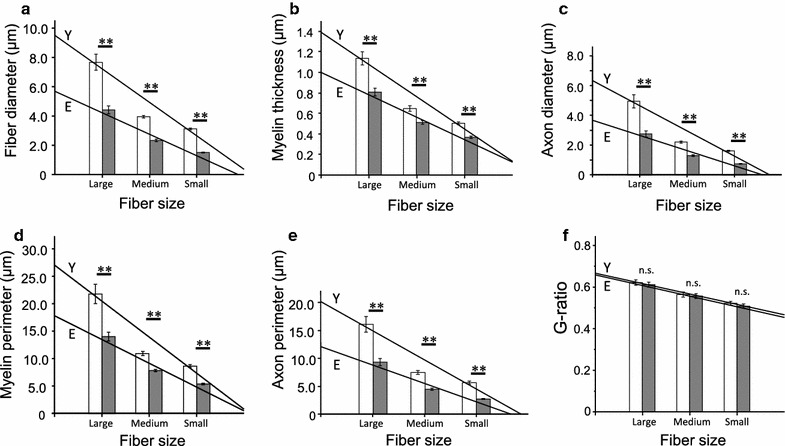
Fig. 2.

Comparison between the young and elderly groups regarding characteristics of myelinated fiber types. The elderly group had a smaller fiber diameter (a), myelin thickness (b), axon diameter (c), myelin perimeter (d), and axon perimeter (e) for all MF sizes (large, medium, and small) in when compared with the young group (f). No significant differences between the young and elderly groups were observed for any fiber size with respect to G-ratio. Open and filled columns in each graph indicate mean values of large, medium, and small myelinated fiber sizes. Y and E in each graph indicate fitted regression lines for the young and elderly groups, respectively (See Table 1 to confirm the regression coefficients and intercepts related to regression lines of the young and elderly groups with respect to each factor). Values are presented as mean ± SEM. ** P < 0.01, young versus elderly. MF myelinated fiber
