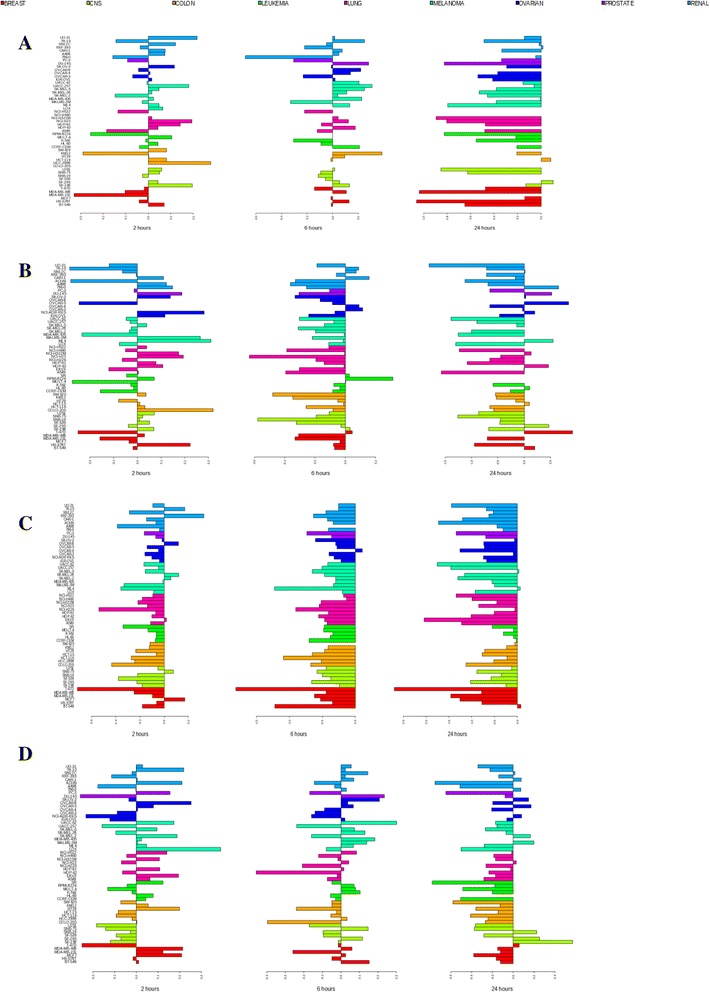
Fig. 1.

Changes in the expression of the DNMT1 methyltransferase gene in the NCI-60 cell line panel. Shown are transcriptional changes of the DNMT1 gene at 2 (left panel), 6 (middle panel), and 24 h (right panel) after treatment with high concentrations of a 5-azacytidine (5000 nM), b doxorubicin (1000 nM), c vorinostat (5000 nM), and d paclitaxel (100 nM). Horizontal right bars indicate elevated gene expression, whereas left bars indicate decreased expression relative to cell lines untreated by the drug. Colors represent types of cancer tissues (breast, central nervous system (CNS), colon, leukemia, lung, melanoma, ovarian, prostate, and renal cancers). The scale on the bottom represents log2 difference between expression values of treated and untreated cell lines. The scale for each microarray experiment is specific to that experiment
