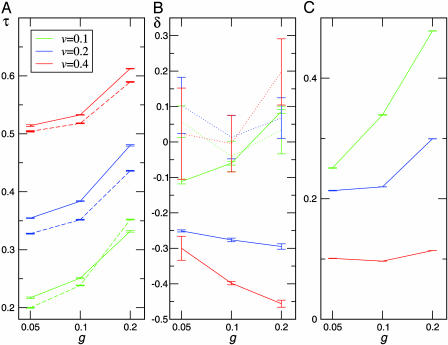
Fig. 3.
Shown are mean transmissibility τ (A), response to signal δ (B), and fraction of consumers in the presence of signal (C) for various values of host growth rate (g) and consumer virulence (v). The dashed lines mark runs without response (δ fixed at 0), and dotted lines mark runs where consumers do not signal but modify their transmissibility by δ at random with the probability given in C. In most cases with communication-based modulation of transmissibility, δ evolves to be significantly negative (more so in runs where signal is more infrequently present), and mean τ is increased accordingly compared with runs without response (A, dashed lines). When modulation occurs at random rather than in response to signal, mean δ is not significantly different from 0 (B, dotted lines). Means were taken over the consumer population, over time between steps 100,000 and 150,000 (or 50,000 and 100,000 for modulation-free runs, which converge very rapidly), and over 10 independent runs; error bars give the expected error in the final average over runs. Fluctuations over time of the population average within individual runs with communication-based modulation had standard deviations in both τ and δ 1/2 to 1 order of magnitude larger than the error bars shown.

