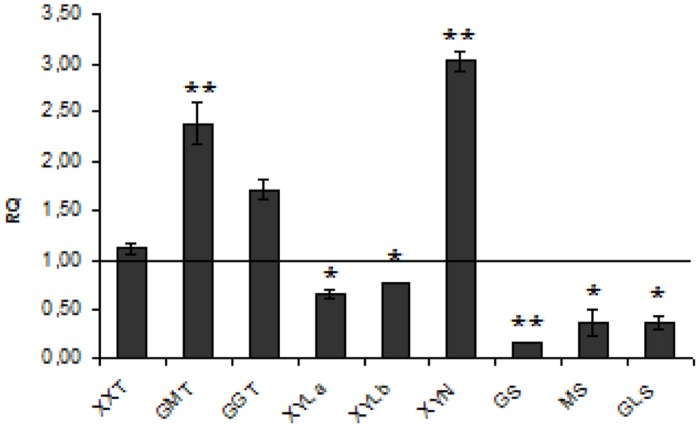
FIGURE 3.
Expression levels of hemicellulose metabolism genes. The mRNA level of hemicellulose synthesis and degradation genes (XXT, GMT, GGT, XYLa, XYLb, XYN, GS, MS, GLS). W86 flax in comparison with control flax obtained from the real-time RT-PCR analysis. The changes in transcript levels were presented as the RQ to the reference gene -actin. The transcript levels were normalized to those of the control plant (C = 1; not presented in the figure). Data represent the mean ± SDs from three independent experiments. The significance of the differences between the means was determined using Student’s t-test (*P < 0.05, **P < 0.01).

