
Figure 2.
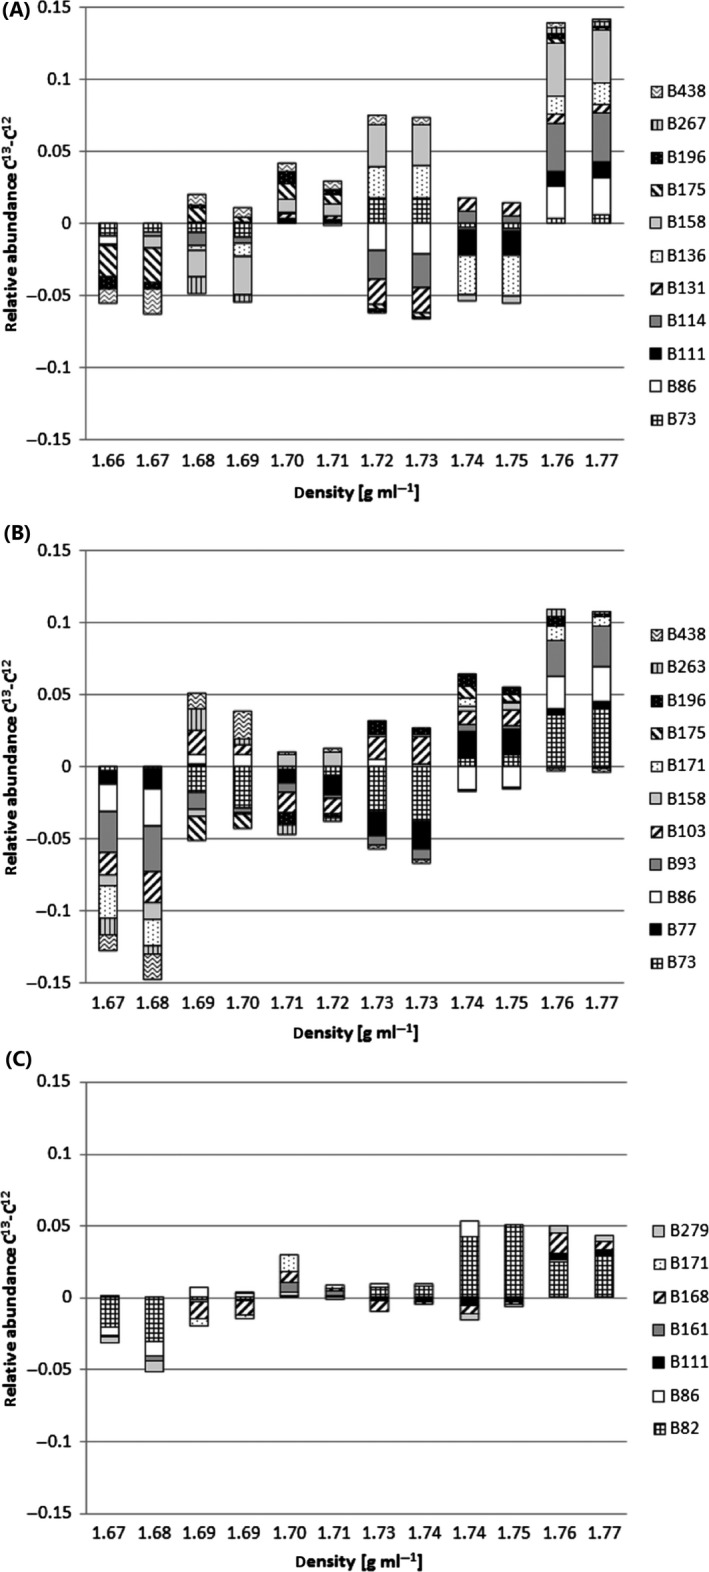
TRFLP fragments showing shifts towards fractions with higher buoyant density in 13C‐labelled microcosms when compared with unlabelled microcosms presented as mean difference between the relative abundance in 13C‐labelled and unlabelled DNA extracts from (A) soil D, (B) soil F and (C) soil W among 12 gradient fractions (n = 3). TRF name refers to TRF length in base pairs.