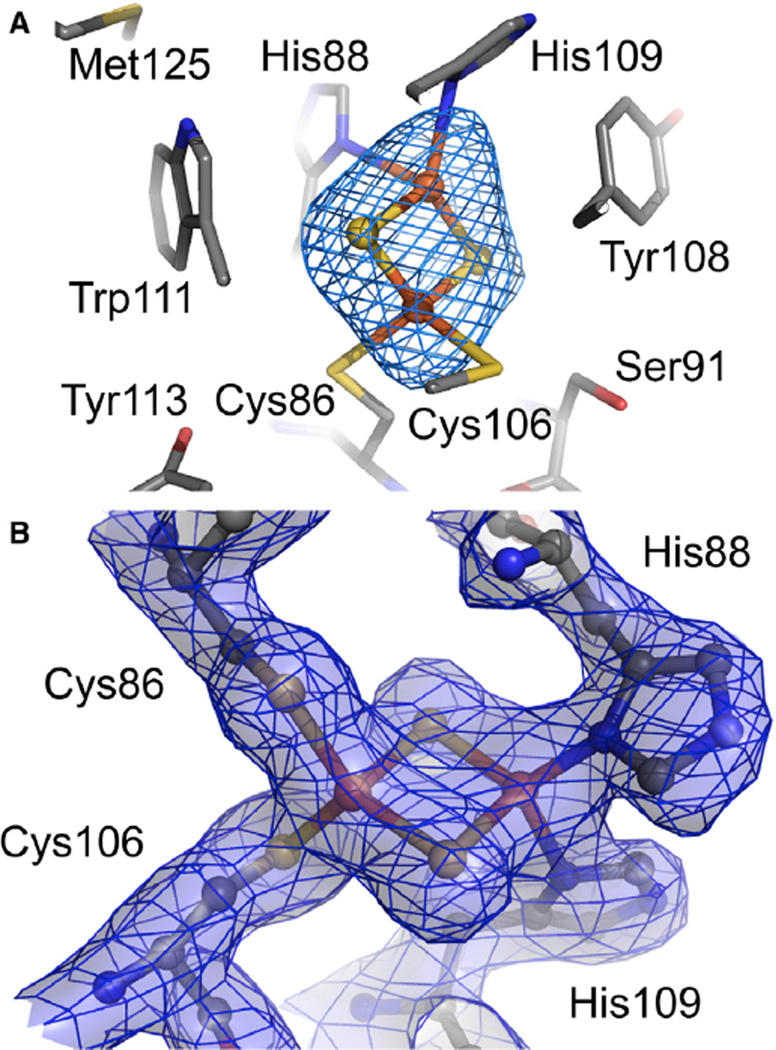
Figure 3. An Example of the Quality of the Electron Density Maps around the Rieske Cluster in the Structure of Stachydrine Demethylase.
(A) The 2Fe-2S Rieske cluster within Stc2 revealed by the 3-Å resolution Fo − Fc omit electron density maps contoured at +3 σ.
(B) The 2 Fo − Fc map to 2.2-Å resolution is contoured at 1.5 σ and displayed as mesh with semitransparent surfaces. Atoms are colored gray, red, blue, yellow, and orange for C, O, N, S, and Fe, respectively. See also Figure S3.

