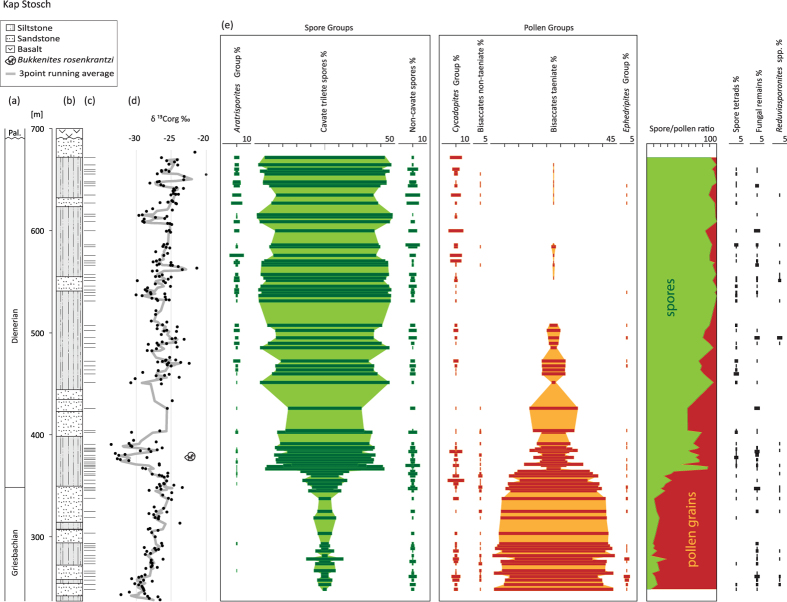
Figure 1. Overview on Griesbachian–Dienerian floras with generalized C-isotope curve.
(a) Age (b) lithology (c) sample levels (d) bulk organic carbon isotopes46 (e) palynological data including relative abundances of groups of spore and pollen grains, spore/pollen ratios as well as spore tetrads, fungal remains and Reduviasporonites spp.

