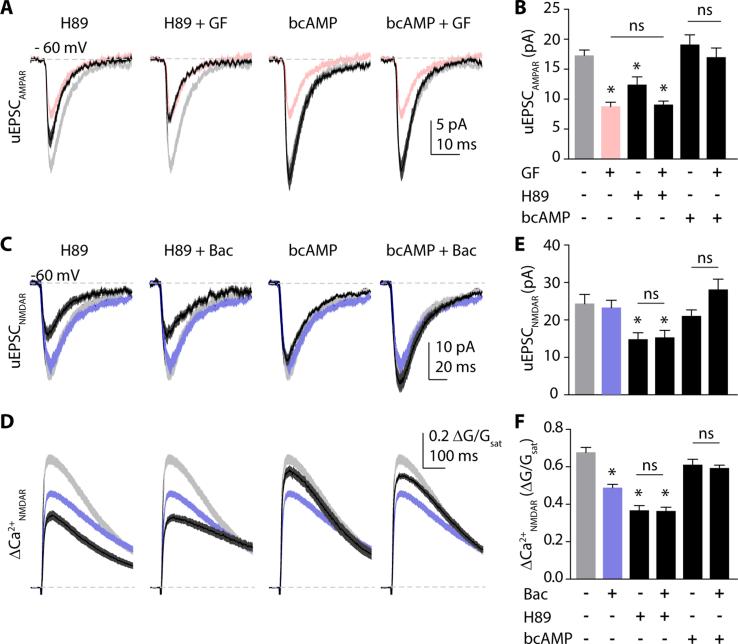
Figure 2.
Both α2R modulation of AMPARs and GABABR modulation of NMDARs are mediated by downregulation of PKA. (A) AMPAR-mediated uEPSCs. Solid black lines show mean ± SEM (dark gray shading) for responses in the PKA antagonist H89 (10 μM), H89 + guanfacine (40 μM), the PKA activator N-6-benzo-cAMP (bcAMP, 100 μM), or bcAMP + guanfacine (left to right). Light gray and red shaded areas represent mean ± SEM of control and guanfacine groups, respectively, for comparison. (B) Bars represent mean amplitudes ± SEM of uEPSC under the above conditions. (C) NMDAR-mediated uEPSCs. Solid black lines show mean ± SEM (dark gray shading) for responses in the PKA antagonist H89 (10 μM), H89 + baclofen (5 μM),the PKA activator bcAMP (100 μM), or bcAMP + baclofen (left to right). Light gray and blue shaded areas represent mean ± SEM of control and baclofen groups, respectively, for comparison. (D) 2PLU-evoked Ca2+ transients under the same conditions as in (C). (E) Bars represent mean amplitudes ± SEM of uEPSC and (F) Ca2+ transients under the above conditions. *: p<0.05, Tukey`s multiple comparison test.

