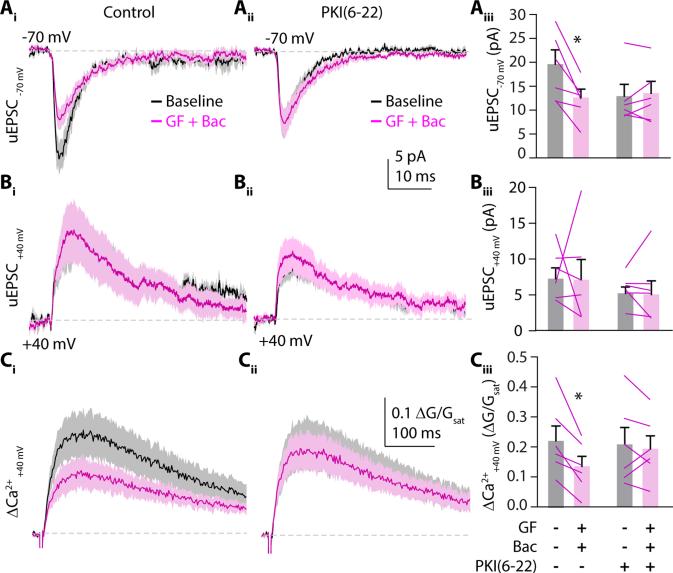
Figure 4.
α2Rs and GABABRs cell autonomously modulate glutamate receptors. (Ai) Mean ± SEM traces (solid lines and shaded areas, respectively) of 2PLU-evoked uEPSCs from a single spine with the cell voltage clamped at −70 mV or at (Bi) +40 mV to measure AMPAR- and NMDAR-mediated currents, respectively. Black traces are uEPSCs during baseline recording, magenta traces show currents following 10 minutes exposure to guanfacine plus baclofen (n=6 spines on 6 cells). (Ci) Mean ± SEM traces (solid lines and shaded areas, respectively) showing ΔCa2+ traces with the cell voltage clamped at +40mV during baseline (black) and after guanfacine plus baclofen flow in (magenta) (Aii-Cii) Same experiment as in (Ai-Ci) but with the membrane-impermeable PKA inhibitor PKI(6-22) (20μM) in the recording pipette (n=6 spines on 6 cells). (Aiii, Biii) Mean ± SEM uEPSC amplitudes (bars) and for each individual cell (lines) recorded at −70 or +40 mV holding potential during baseline (gray) and post guanfacine and baclofen (magenta) using control- or PKI(6-22)-containing pipette solution. (Ciii) As above for NMDAR-mediated Ca2+ transients. *: p<0.05, paired t-test.

