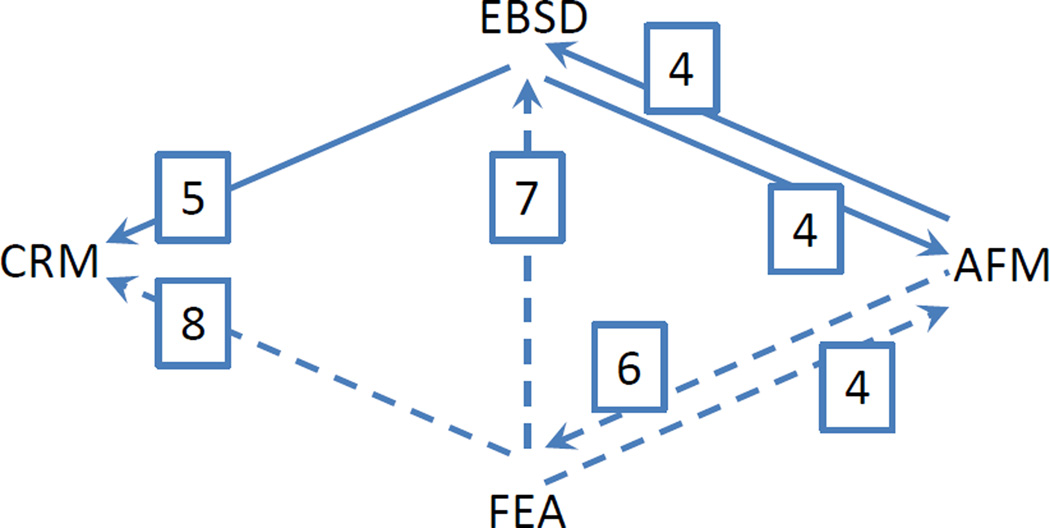
Fig. 2.
Diagram showing the interrelations between predictions made from the three microscopy techniques, AFM, EBSD, and CRM, and the FEA model; the directions of the arrows indicate the direction of prediction or constraint and the boxed numbers indicate the relevant figure comparing measurement with prediction. Solid connectors indicate direct experimental predictions and dashed connectors indicate model-mediated predications.

