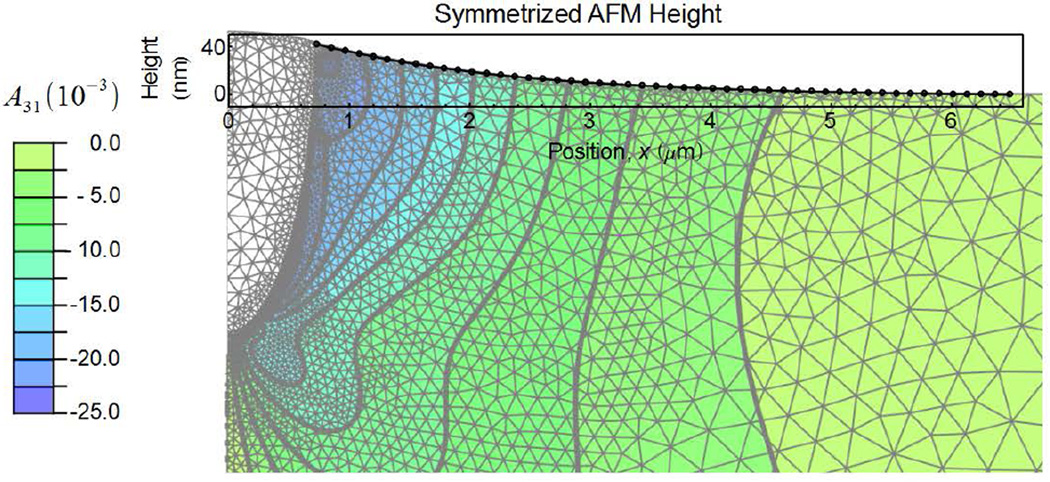
Fig. 6.
A schematic diagram of the FEA model of elastic deformation adjacent to a wedge indentation, symmetric about x1 = 0. The initial semi-elliptical stressed region is shown as the white elements. The elastic region is shown as colored contours of the distortion tensor element A31=∂u3/∂x1 related to rotation about an axis perpendicular to the diagram. Vertical displacements are multiplied by 14 for visualization. The measured AFM height profile used to adapt the model is shown to identical scale as the overlayed plot.

