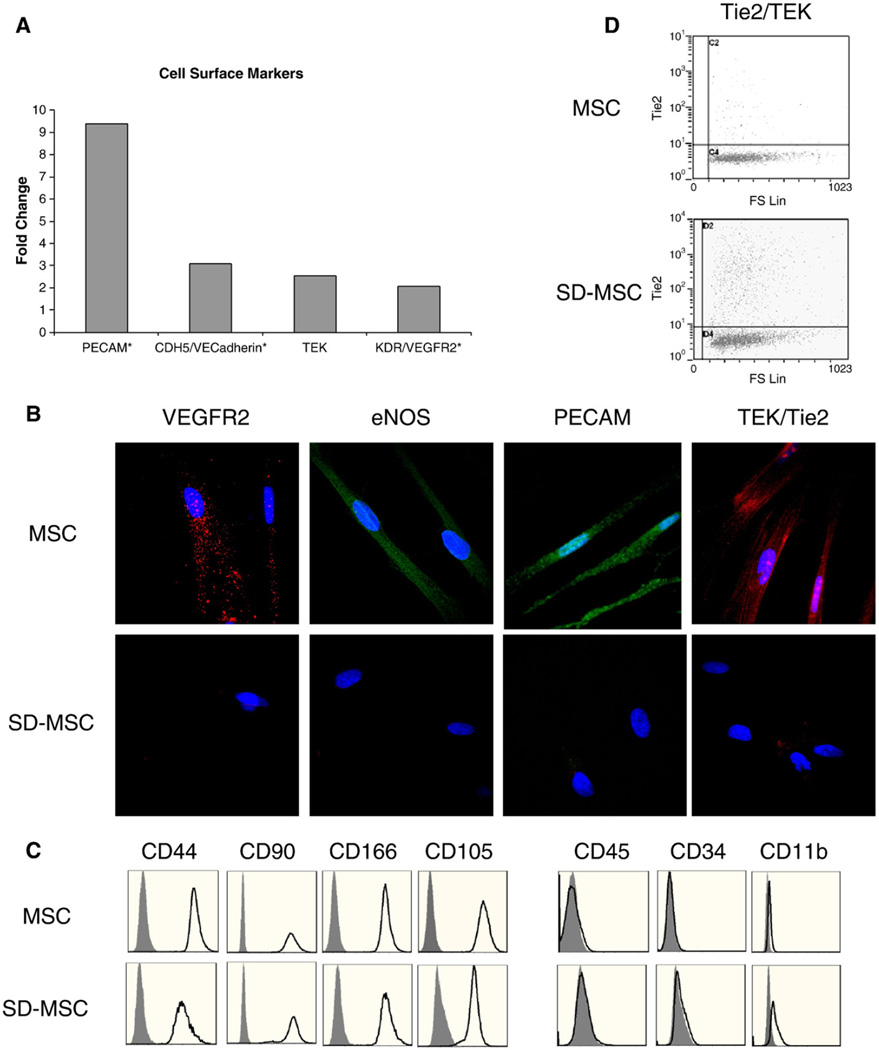
Figure 3.
SD-MSCs express both endothelial and mesenchymal markers. (A) Relative expression of mRNA for endothelial markers in SD-MSCs on Day 30 of serum deprivation compared to MSCs. Samples below the threshold of detection are marked with a #, with fold change calculated form the lowest detectable level of mRNA. (B) Immunofluorescent images of MSCs and SD-MSCs. Samples are counterstained with DAPI (blue). Original magnification, 600×. (C) Flow cytometric analysis of cell surface proteins of MSCs and SD-MSCs on Day 30 of serum deprivation. Open areas represent specified epitopes, gray areas represent isotype controls. Histograms demonstrate event number (y axis) vs fluorescent intensity (x axis). (D) Flow cytometric analysis of Tie2/TEK for MSCs and SD-MSCs on Day 30 of serum deprivation. A scatter plot of fluorescent intensity (y axis) vs forward scatter is shown.

