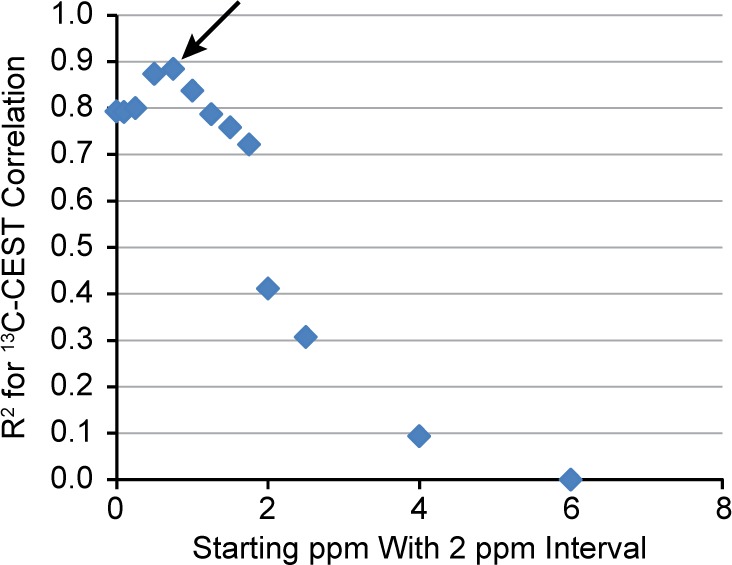
Figure 6.

R2 value for the 13C NMR–CEST correlation as a function of which region of the MTRasym curve was used for integration. The x-axis represents the beginning of the integration region, and a 2 ppm interval was used. Note that the maximum R2 value occurs at approximately 0.5 ppm (arrow) suggesting that the optimal range of the MTRasym curve to use for integration is 0.5–2.5 ppm. Data shown is for the group of measurements made after glucagon was administered to the perfused livers; however, the data from the preglucagon measurement is similar.
