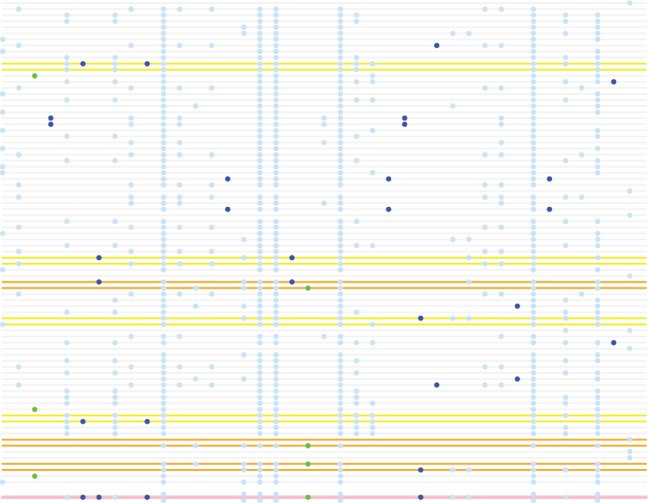
Fig. 1.

Example of copying state selection. A reference panel of 80 haplotypes in a window of 40 SNPs is represented by horizontal grey lines with non-reference alleles shown as coloured circles. An unphased individual is shown beneath the reference panel (pink line). Alleles at SNPs with a minor allele count (MAC) in the panel of 2 and 3 are coloured dark blue and green respectively. Haplotypes selected due to sharing of alleles with MAC = 2 sites are highlighted in yellow. Haplotypes selected due to sharing of alleles with MAC = 3 sites are highlighted in orange. In total 14 haplotypes are selected using MAC = 2 and MAC = 3 sites. The haplotype selection process proceeds in a similar fashion utilizing MAC >3 sites until K haplotypes are selected
