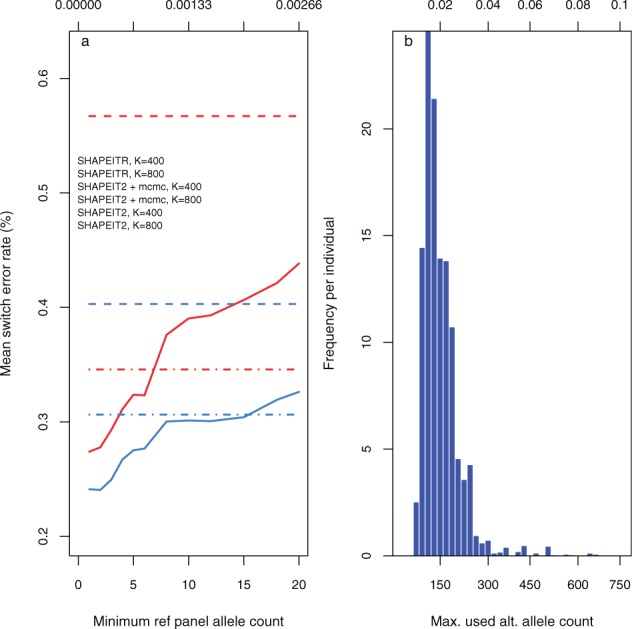
Fig. 3.

Properties of using rare variants for state selection. (a) Effect on switch error rate of varying the minimum minor allele count used for selecting individuals from whom to copy in SHAPEITR. Horizontal axes: minimum minor allele count (bottom) and corresponding frequency in panel (top) used for selection. Solid lines: mean switch error rates for SHAPEITR; dashed (and dashdot) lines: mean switch error rates for SHAPEIT2 with (and without) MCMC. Colours indicate whether (red) or (blue) copying states were used. In both cases, errors refer to phasing the whole of chromosome 20 and were averaged over both trio parents and 20 runs. (b) Distribution of maximum allele counts used for matching in a single window when choosing K = 400 copying states. Horizontal axis: maximum minor allele count (bottom) and corresponding frequency in the reference panel (top) of a site used for matching. Vertical axis: frequency averaged over both trio parents and 20 different runs. Each bar represents a bin of width corresponding to an allele count of 20
