
Fig. 3.
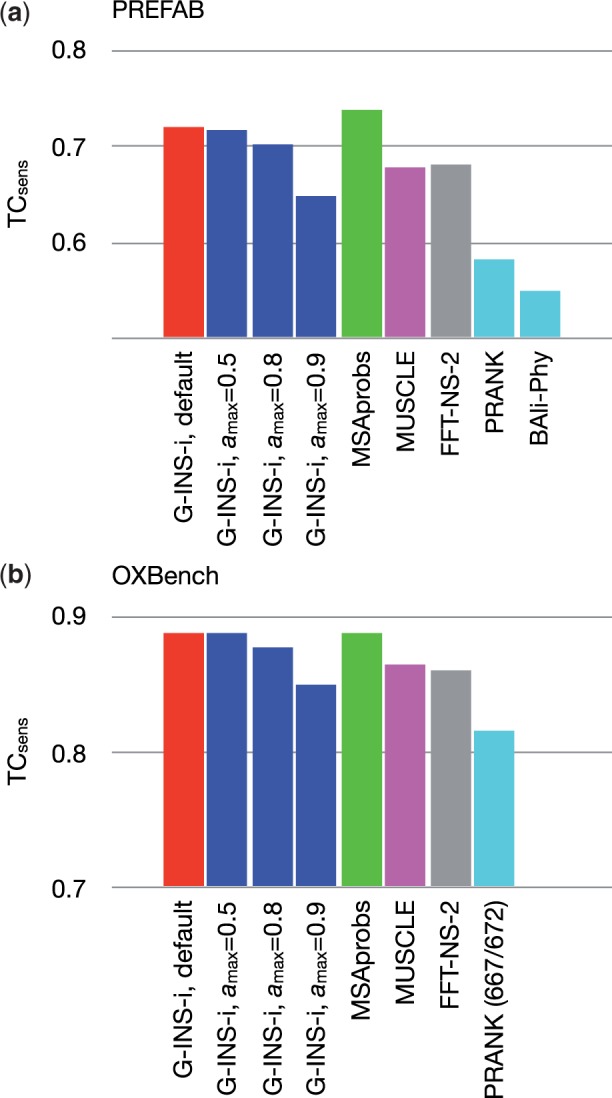
Comparison of sensitivity based on two real protein-based benchmarks. (a) In the PREFAB test, the score (Eq. 7) was computed with the qscore program (Edgar, 2004a) and averaged for the 1682 entries. The scores of BAli-Phy with the two initial states were similar to each other, 0.5465 and 0.5480. (b) In the ‘extended’ subset of OXBench, the column score was computed using the run_metric.pl program (Raghava et al., 2003) and averaged for the 672 entries. For PRANK, the average for 667 entries are shown because it failed in five entries. BAli-Phy was not applicable to this test, because the maximum number of sequences in an MSA is 668