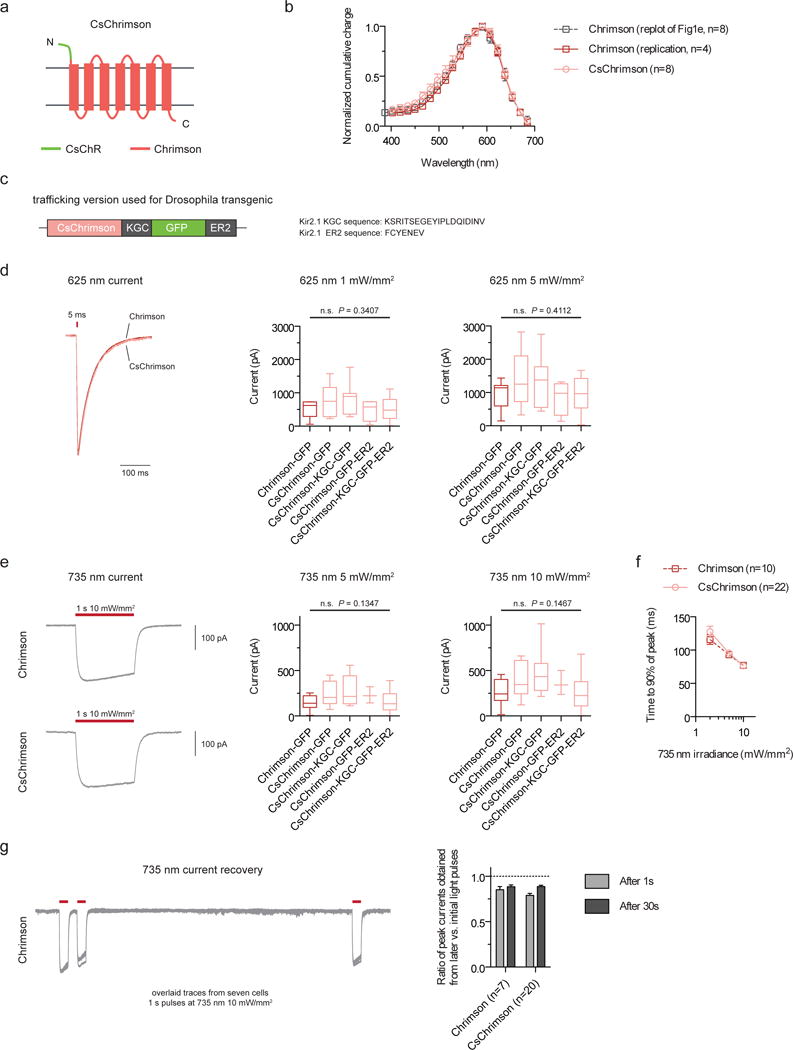
Figure 1. CsChrimson characterization in cultured cells.

(a) Schematic of CsChrimson chimera. (b) Action spectra for Chrimson and CsChrimson, as well as the Chrimson spectrum data from the original manuscript (HEK293 cells; measured using equal photon fluxes of ~2.5 × 10²¹ photons/s/m2). (c) Schematic of trafficking sequences used to generate the CsChrimson Drosophila transgenics. (d–e) Maximum photocurrents in response to red (625-nm) and far-red (735-nm) light as measured in cultured neurons. (f–g) Turn-on (f) and recovery kinetics (g) in response to 735-nm light. CsChrimson kinetic data were pooled from all trafficking versions. All constructs in this panel were expressed under CaMKII promoter and selected based solely on the presence of co-transfected cytosolic tdTomato expression. Illumination conditions are as labeled in each panel. Box plot whiskers represent minimum and maximum data points. Box limits represent 25th percentile, median, and 75th percentile. n values: Chrimson-GFP (n = 9 cells in d, n = 12 cells in e), CsChrimson-GFP (n = 7 cells in d, n = 8 cells in e), CsChrimson-KGC-GFP (n = 7 cells in d, e), CsChrimson-GFP-ER2 (n = 4 cells in d, n = 3 cells in e), and CsChrimson-KGC-GFP-ER2 (n = 10 cells in d, n = 11 cells in e). Plotted data are mean ± s.e.m. in b, f, and g. ANOVA with Dunnett’s post hoc test with Chrimson-GFP as reference in d, e.
