
Figure 3. Unsupervised hierarchical clustering based on a 38-gene expression profile in bone marrow samples from breast cancer patients.
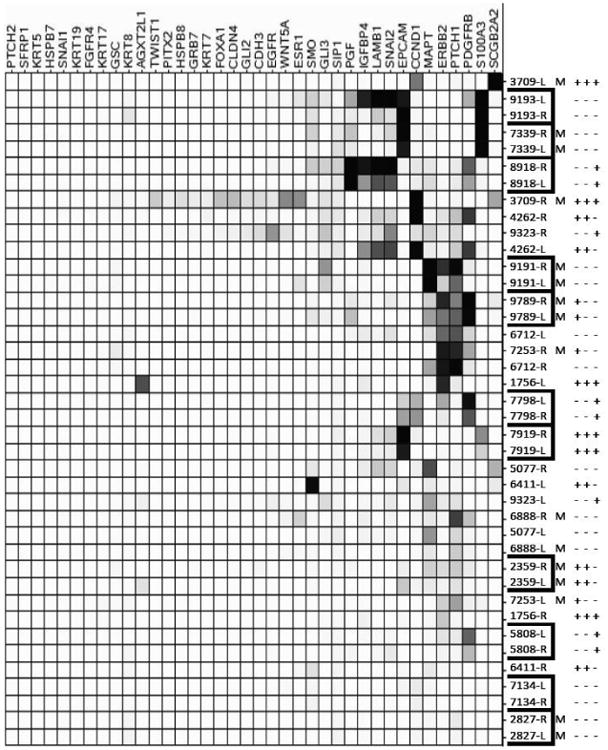
Each row represents an individual sample (either left- L or right-R sampling) from 20 individual patients with a known breast tumor molecular phenotype (ER, PR, Her2 indicated with +/-). Eight patients developed metastatic disease (denoted by M) within 5 years of diagnosis. Each column represents relative expression of each gene in each sample. Expression is scaled based on number of SD above the mean of a set of 11 health control bone marrow samples analyzed in the same assay. Gene transcripts and samples are ordered and grouped based upon similar patterns of expression. Corresponding values for normalized hybridization counts for differentially expressed genes are shown in Supplemental Table 7.