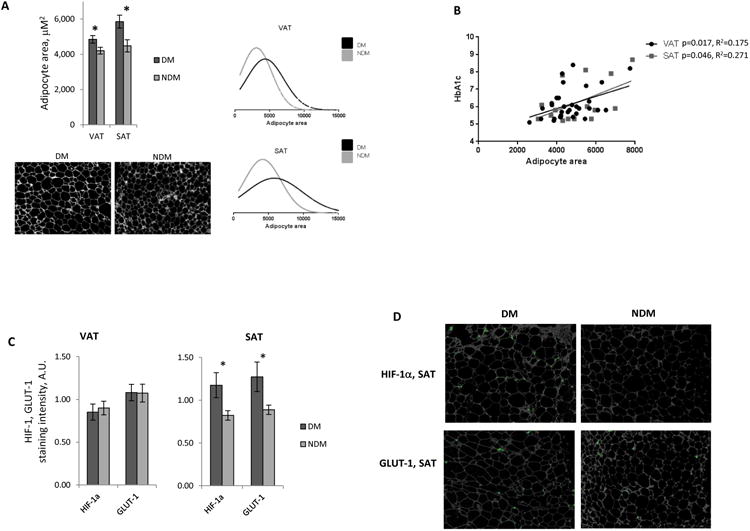
Figure 1. Adipocyte hypertrophy is increased in DM humans with obesity.

A. Above left: Age-adjusted adipocyte area in VAT and SAT in DM and NDM subjects; ordinate: mean adipocyte area, μm2; *: p<0.050 comparing DM and NDM groups. Below left: Representative VAT adipocyte sizing images from DM, NDM subjects; Right: Distribution of adipocyte size in VAT and SAT for DM and NDM subgroups, abscissas: adipocyte area, μm2; n=22 DM, 29 NDM subjects for VAT, and n=10 DM, 10 NDM subjects for SAT.
B. Linear regression analysis correlating adipocyte area with preoperative HbA1c (%).
C. Quantified HIF-1α, GLUT-1 immunohistochemistry staining intensity in VAT, SAT, ordinate: immunohistochemistry staining intensity normalized to adipocyte number, arbitrary units (A.U.); *: p<0.050 comparing DM and NDM groups; n=10 DM, 10 NDM subjects for VAT and SAT.
D. Representative HIF-1α and GLUT-1 Immunohistochemistry images (HIF-1α, GLUT-1: green) of SAT from DM and NDM subjects.
