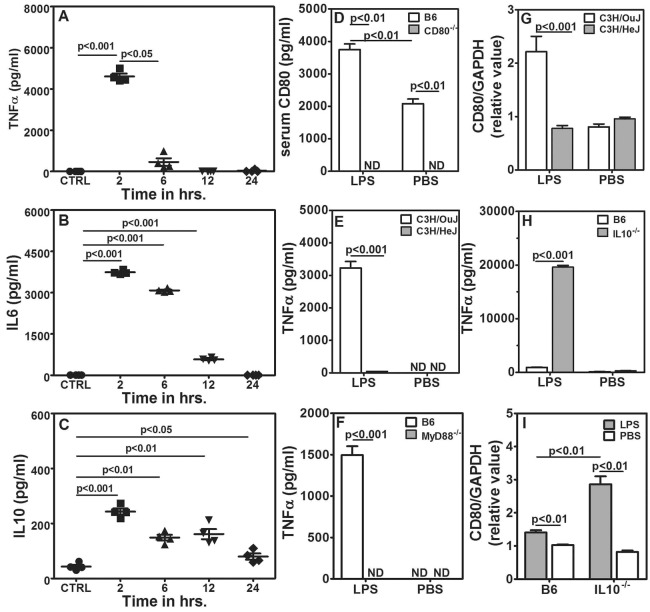
Fig. 4.
Systemic TNFα is responsible for albuminuria and CD80 upregulation. (A-C) TNFα (A), IL-6 (B) and IL-10 (C) levels in sera from B6 mice given PBS (CTRL) or LPS. Sera were collected at the times after treatment as indicated (four mice per group). (D) serum CD80 levels in B6 and CD80−/− mice treated with LPS or PBS (five mice per group). (E) Serum TNFα levels 2 h after injection of LPS or PBS from C3H/HeJ and C3H/OuJ mice (five mice per group). (F) Serum TNFα levels 2 h after injection of LPS or PBS from MyD88−/− and B6 mice (five mice per group). (G) Relative CD80 mRNA expression levels in E11 podocytes that had been exposed to serum from C3H/HeJ and C3H/OuJ mice given PBS or LPS (n=8, four independent experiments). (H) Serum TNFα levels 2 h after injection of 3 μg LPS or PBS from B6 and IL-10−/− mice (five mice per group). (I) Relative CD80 mRNA expression levels in E11 podocytes that had been exposed to serum from B6 and IL-10−/− mice given PBS or 3 μg LPS (n=6, three independent experiments). Data represents mean±s.e.m. ND, not detectable.

