Fig. 3.
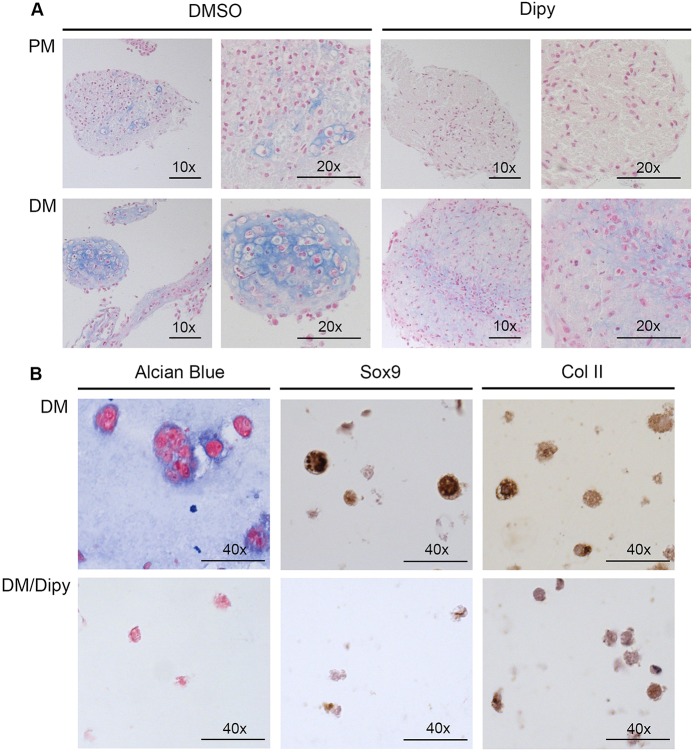
Histological analysis of ATDC5 chondrogenic differentiation. (A) Alcian Blue staining of sections from ATDC5 cell 3D cultures grown in proliferative medium (PM, upper panels) and in differentiation medium (DM, lower panels), in the presence of 50 µM Dipy or DMSO. Scale bars: 100 μm (10×) and 50 μm (20×). (B) Histological and immunohistochemical analysis of ATDC5 cells cultured as alginate spheres grown in DM in the presence of DMSO or 50 µM Dipy (upper and lower panels, respectively). Scale bars: 25 μm.

