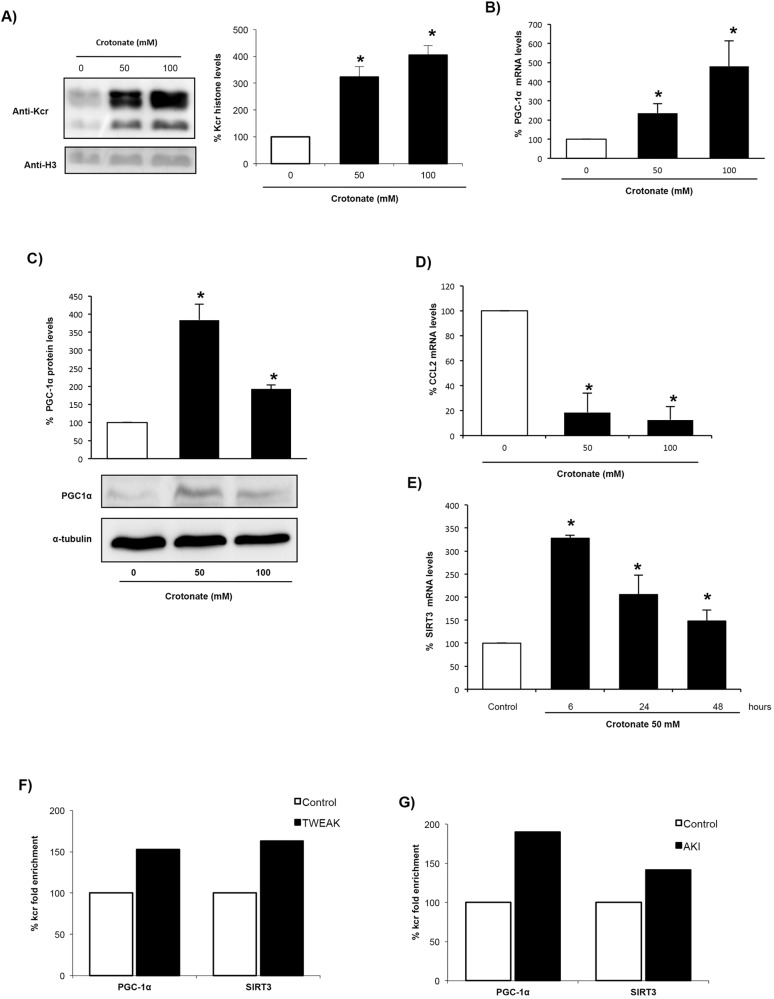
Fig. 3.
Crotonate increases histone crotonylation and modifies gene expression in cultured proximal tubular epithelial cells. Cells were stimulated with 0, 50 or 100 mM crotonate for 24 h. (A) Quantification of histone crotonylation (anti-Kcr) and representative western blot. Mean±s.e.m. of three independent experiments; *P<0.05 vs 0 mM crotonate (non-parametric Mann–Whitney U-test). (B,D) PGC-1α and CCL2 mRNA levels. Data from eight independent experiments expressed as mean±s.e.m. *P<0.05 vs control (Student's t-test). (C) PGC-1α western blot of whole-cell extracts. Data from four independent experiments is expressed as mean±s.e.m. *P<0.05 vs control (non-parametric Mann–Whitney U-test). (E) SIRT3 mRNA levels in tubular cells exposed to 50 mM crotonate. Data from four independent experiments expressed as mean±s.e.m. *P<0.05 vs control (non-parametric Mann–Whitney U-test). (F,G) ChIP-seq analysis was performed using a pan anti-Kcr antibody in (F) tubular cells incubated with 100 ng/ml TWEAK for 6 h (data from three independent experiments) and (G) kidney tissue from mouse AKI (six animals per group). Results show the percentage of Kcr enrichment.

