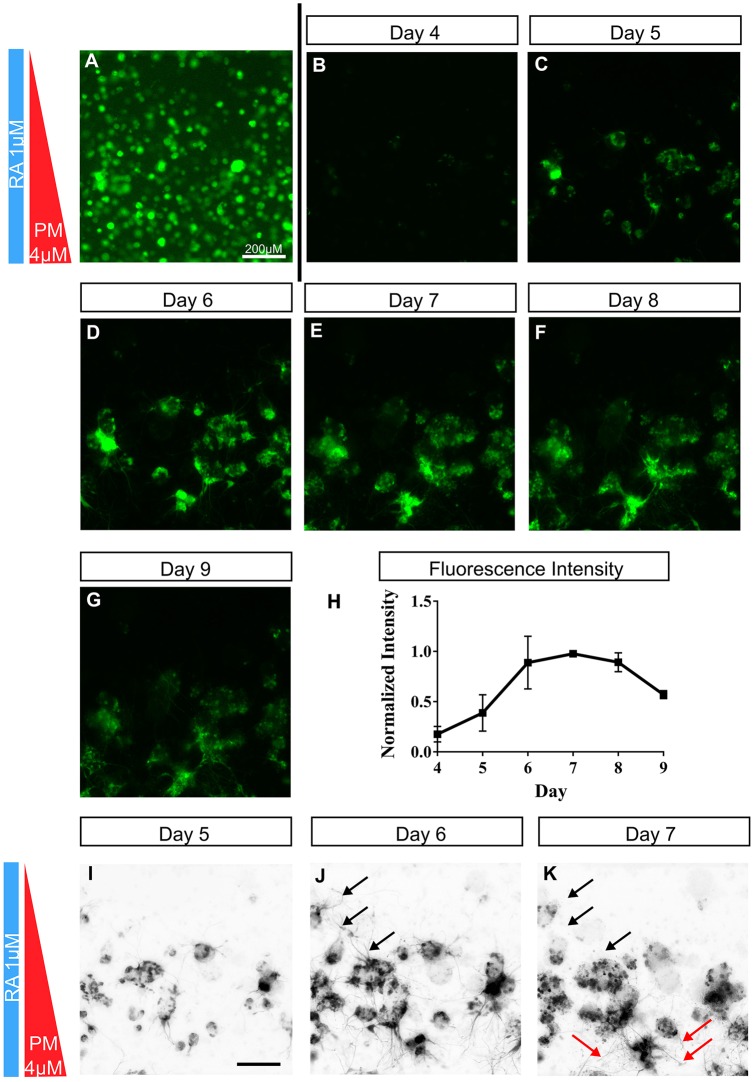
Fig. 5.
Time-lapse imaging in the microdevice reveals dynamic expression patterns. (A) Contrast has been artificially enhanced in this image to illustrate seeding density. (B-G) Images for subsequent days were acquired every 24 h at a constant intensity. (H) Quantification of GFP intensity over time reveals a pattern of expression similar to that found in vivo (mean intensity ±s.d., n=3). (I-K) Inverted images are shown to enhance neurite visibility. Black arrows illustrate regions of omnidirectional neurite growth on day 6 that were redirected towards higher concentrations of PM (red arrows) on day 7.

