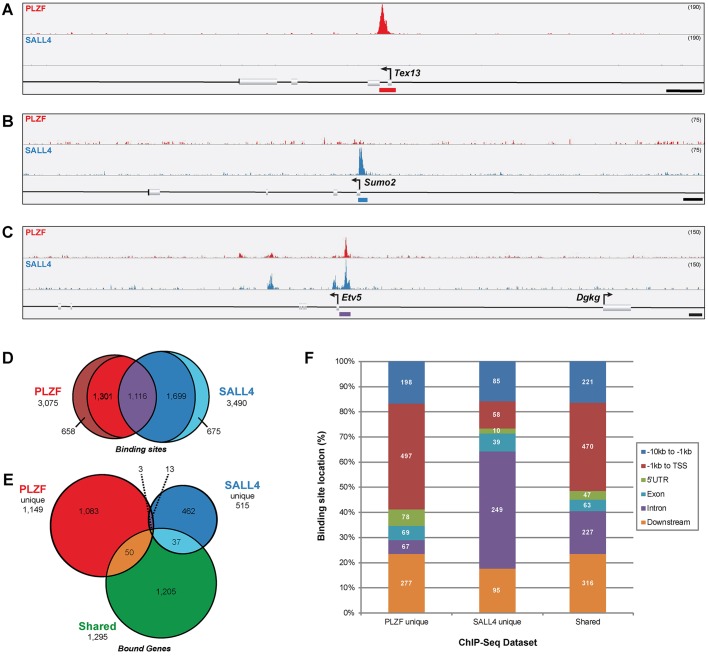
Fig. 1.
PLZF and SALL4 bind unique and shared genomic sites in undifferentiated spermatogonia. (A-C) Histogram tracks show the abundance of PLZF and SALL4 ChIP DNA in mouse undifferentiated spermatogonia with binding site peaks indicated by colored bars below the reference sequence annotation. Some binding sites were unique to (A) PLZF (red curve, Tex13) or (B) SALL4 (blue curve, Sumo2), whereas others (C) were bound by both PLZF and SALL4 (shared, Etv5). Scale bars: 1 kb. Track height is indicated in parentheses at the top right. See Fig. S3 for all three biological replicates for each example ChIP peak. (D) Overlap between all PLZF (red) or SALL4 (blue) binding sites, including shared sites (purple) and unique sites (outer crescents, no overlap with the other factor). Non-unique and shared sites exhibiting partial overlap are also noted (1301 PLZF and 1699 SALL4). (E) Annotated genes within 10 kb of PLZF unique (red), SALL4 unique (blue) or shared (green) binding sites. Overlap between groups is from some genes that are located within 10 kb of more than one binding site. (F) Binding site positions relative to annotated genes were categorized as: −10 kb to −1 kb 5′ to the TSS (distal promoter); −1 kb to TSS (proximal promoter); 5′UTR; exon; intron; or downstream (transcription termination site +10 kb). The number of peaks (binding sites) falling into each category is indicated within the bars. For binding sites associated with multiple genes (Table 1), all relative positions are reported.

