Fig. 2.

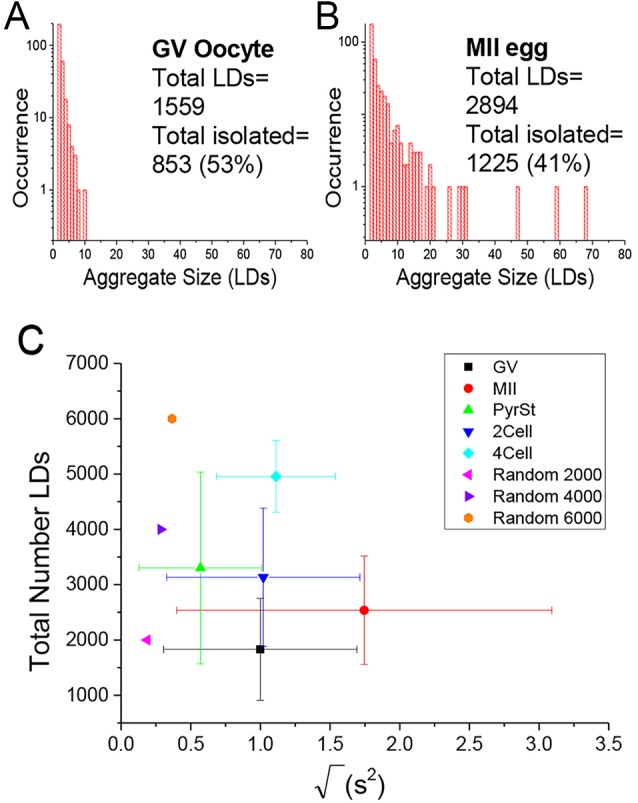
Lipid droplet quantification and clustering analysis. (A,B) Histograms of LD aggregate sizes (number of LDs in each cluster, and their occurrence) in a typical (A) GV oocyte, and (B) MII egg. Total number of LDs and total number of un-clustered LDs are also indicated. (C) Scatter plot of the square root of the mean square aggregate size ( ) against the total number of LDs, in ensembles of GV oocytes (n=33), MII eggs (n=30), MII eggs starved of pyruvate (PyrSt; n=8), two-cell (2Cell; n=10) and four-cell (4Cell; n=8) embryos (including those represented in Fig. 1). The distribution of each variable in the corresponding ensemble is shown as a mean (symbol) and standard deviation (bar). The case of a random LD distribution simulated for a range of total number of LDs is also shown for comparison.
