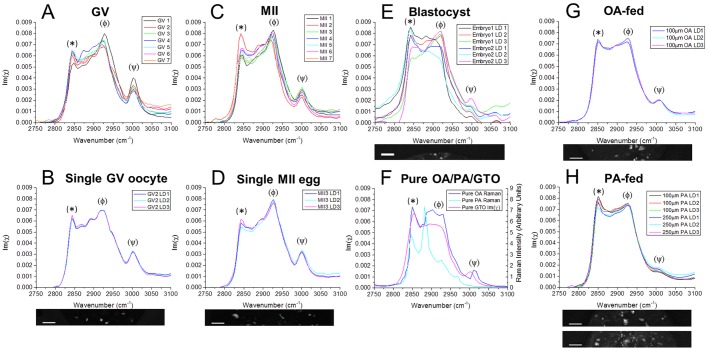
Fig. 6.
Hyperspectral imaging of chemical content of oocytes, eggs and embryos. (A-E) Vibrational Raman-like spectra Im(χ) obtained from CARS hyperspectral images. (A) Example LDs in all GV oocytes (n=7) and (B) three LDs in the same GV oocyte, shown in the accompanying image. (C) Example LDs in all MII eggs (n=7) and (D) three LDs in the same MII egg, shown in the accompanying image. (E) Three LDs in two different blastocyst stage embryos, ‘Embryo 2’ shown in the accompanying image. (F-H) Raman spectra of (F) pure oleic acid (OA) and palmitic acid (PA) in the solid (ordered) phase (digitised from spectra given by Sigma), against the retrieved PCKK spectrum of glycerol trioleate (GTO; oleic acid in its triglyceride form), (G) three LDs in an MII egg in vitro matured in 100 µM oleic acid (n=16), and (H) three LDs in MII eggs in vitro matured in 100 µM (n=31) or 250 µM palmitic acid (n=33), LDs shown in the accompanying images. Spectra are normalised to the total area. Peaks: (*) ∼2850 cm−1 correspond to the symmetric CH2 stretch; ∼2880 cm−1 to the asymmetric CH2 stretch, especially enhanced in ordered/solid-phase; (φ) ∼2930 cm−1 to CH3 and asymmetric CH2 stretch vibrations, enhanced in disordered/liquid-phase acyl chains; (ψ) ∼3010 cm−1 correspond to the =CH stretch. Note, the intensity ratio between bands at 2880 cm−1 and 2850 cm−1 can be used as a measure of acyl chain order; the ratio between peaks at 2930 cm−1 and 2850 cm−1 can be used to ascertain chain disorder. Accompanying images show the 10 µm×80-100 µm area over which hyperspectral scans were obtained. Scale bars: 10 µm. Data from ≥2 trials, using 1-3 mice each.

