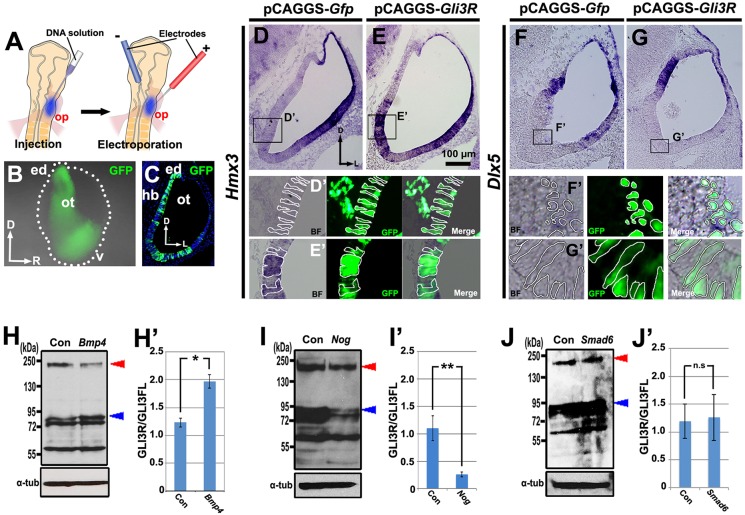
Fig. 4.
Gli3R overexpression induces ectopic expression of Hmx3, but not of Dlx5, and increasing or decreasing BMP signaling alters the GLI3R/GLI3FL ratio in opposite directions. (A-C) Transfection scheme for D-G′,J,J′. (A) Diagram showing electroporation into the ventral otic placode to target the ventromedial otocyst. (B) Whole-mount view 18-24 h after electroporation of Gfp. The borders of the otocyst are indicated by white dots. (C) Transverse section of the same embryo shown in B. (D-G′) In situ hybridization for Hmx3 (D-E′) or Dlx5 (F-G′) expression on transverse sections of otocysts collected after transfection when embryos reached HH stages 20-21. Boxed regions are shown in D′-G′, with borders of selected cells outlined. (H-J′) Western blots and graphs of mean GLI3R/GLI3FL ratios in whole chick otocysts collected at the desired stage after overexpression of Gfp (Con) or Bmp4, Nog or Smad6. Blue arrowhead indicates GLI3R; red arrowhead indicates GLI3FL; α-tub, α-tubulin. Otocysts in H,H′ were from embryos transfected as in Fig. 1A, and those in I,I′ were from embryos transfected as in Fig. 2A. *P<0.05, **P<0.01; n.s., not statistically significant. n=5 (D,E,H-J) or n=6 (F,G) control and experimental otocysts. Error bars indicate s.d. d, dorsal (in B); v, ventral; other abbreviations as in Fig. 1.

