Fig. 6.
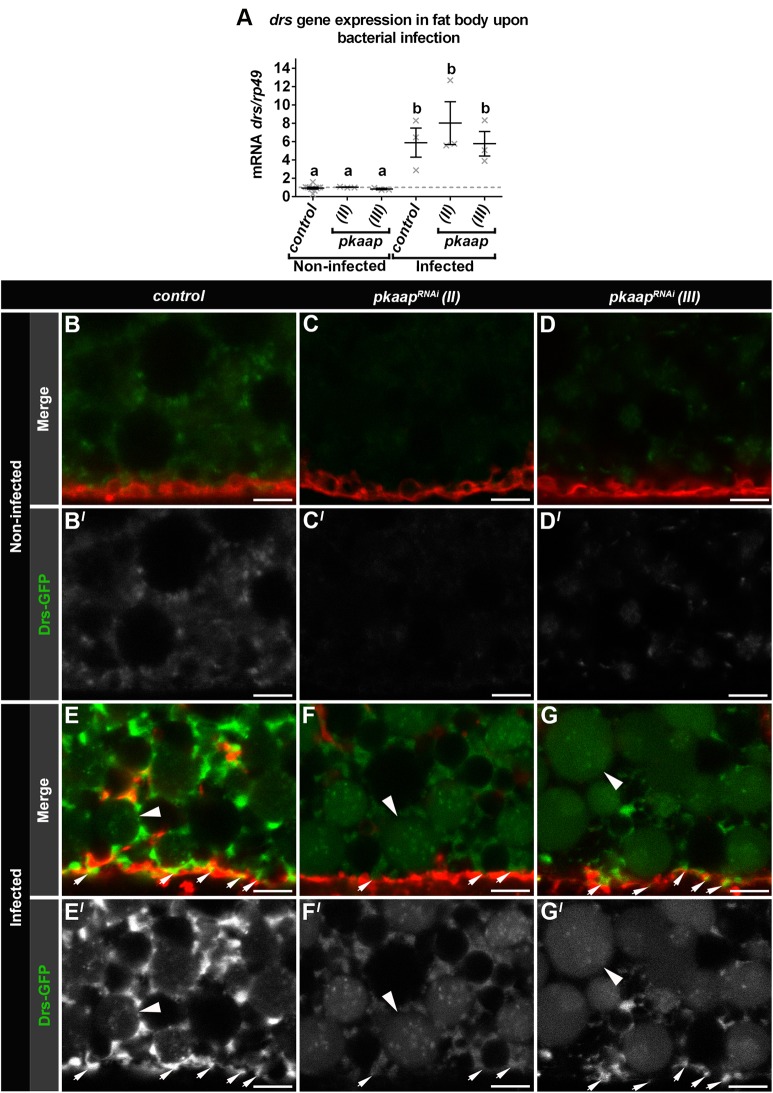
pkaap depletion reduced the amount of Drosomycin at the plasma membrane. (A) The expression of drosomycin (drs) mRNA was characterised by quantitative real-time PCR. mRNA levels were normalised against rp49 mRNA levels. Three independent sets of samples were collected from late third larval instar (−4 h puparium formation) from non-infected larvae and larvae infected orally with Micrococcus luteus and Escherichia coli. One-way ANOVA and Tukey's multiple comparison test showed significant differences between the means in genotypes (depicted by different letters on the bars, P<0.0001). Data presented as mean±s.e.m. (B-G) Confocal micrographs showing the intracellular distribution of Drosomycin-GFP in fat body cells (green in A-G; greyscale in A′-G′) with the plasma membrane outlined by CellMask™ Deep Red (red in A-G). Fat body cells were visualised from (B-D) non-infected larvae and (E-G) larvae infected orally with Micrococcus luteus for 4 h. Arrows depict Drosomycin-GFP at the plasma membrane. Arrowheads depict large Drosomycin-GFP compartments. Representative larval fat body cells were from the following genotypes: (B,E) control, (C,F) pkaapRNAi chromosome II and (D,G) pkaapRNAi chromosome III. Scale bar: 5 μm.

