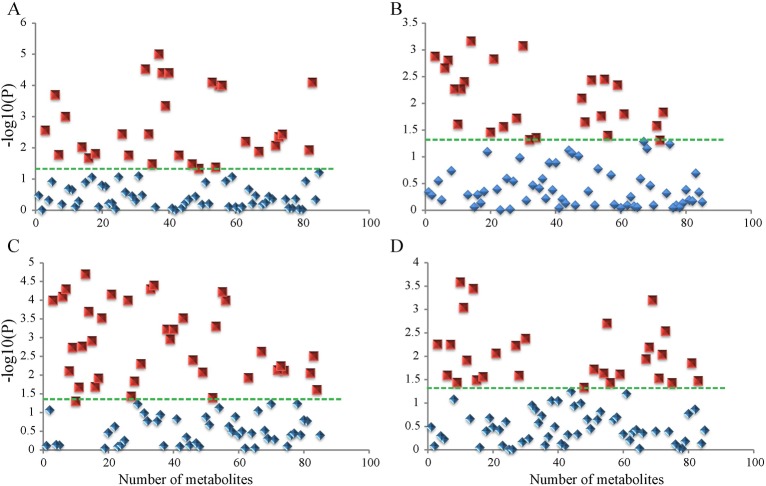
Fig. 2.
One-way ANOVA analyses of endotesta and embryo metabolites in walnuts. Metabolites identified as statistically significant (P<0.05; green dotted line) are shown as red squares while non-significant metabolites are shown as blue diamonds. (A) Metabolites of stage 1 to stage 5 in embryos. (B) Metabolites of stage 1 to stage 5 in endotesta. (C) Metabolites of stage 1, stage 3, and stage 5 in embryos. (D) Metabolites of stage 1, stage 3, and stage 5 in endotesta.

