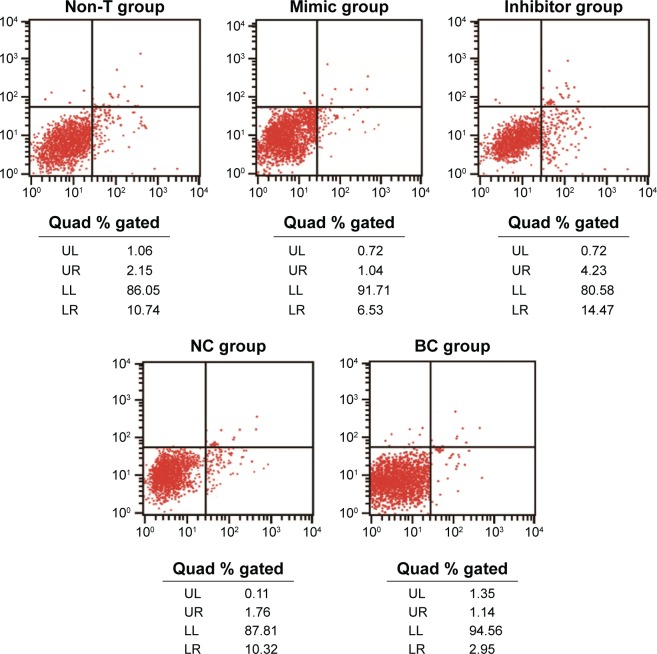
Figure 8.
A scatter diagram was used to reflect cell apoptosis in the mimic, inhibitor, NC, and non-T groups.
Note: The mimic group had a decreased cell apoptosis rate, but the inhibitor group had an increased cell apoptosis rate compared with the non-T group.
Abbreviations: NC, negative control; Non-T, nontransfected; UL, upper left; UR, upper right; LL, lower left; LR, lower right.

