
Figure 3.
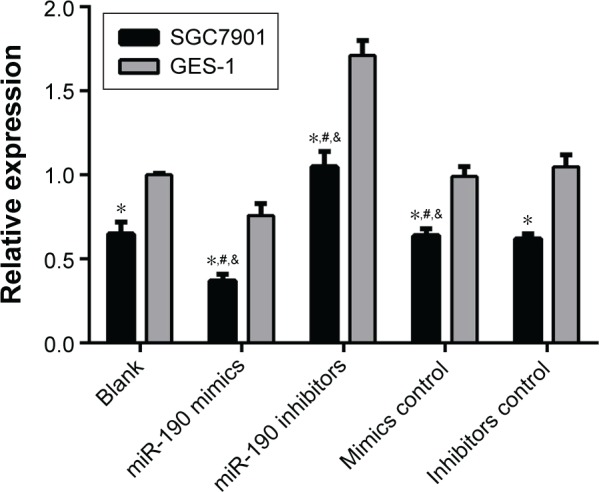
The expression differences of FOXP2 before and after transfections of SGC7901 and GES-1.
Notes: *Compared with GES-1, P<0.05; #compared with blank group, P<0.05; &compared with mimics control group and inhibitors control group, P<0.05.
Abbreviation: miR-190, microRNA-190.