Fig. 1.
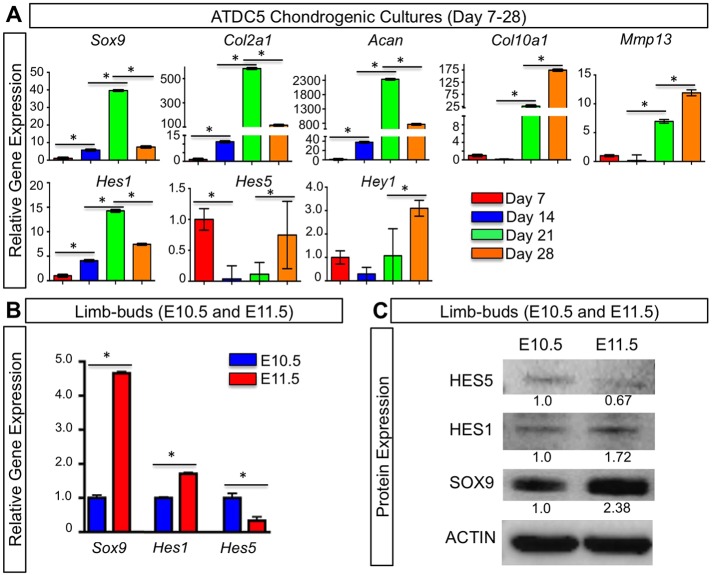
HES and HEY expression during chondrogenesis and chondrocyte hypertrophy. (A) qPCR gene expression analyses for Sox9, Col2a1, Acan, Col10a1, Mmp13, Hes1, Hes5 and Hey1 on RNA isolated from ATDC5 cells cultured for 7–28 days in ITS-supplemented medium. (B) qPCR analysis for Sox9, Hes1 and Hes5 on RNA isolated from WT limb buds at E10.5 and E11.5. The y-axis represents relative gene expression normalized to that of β-actin and then to expression in cultures at day 7. Bars represent means±s.d. *P<0.05 (one-way ANOVA followed by Bonferroni method and Student's t-test). Bars under asterisks identify relevant statistical comparisons. (C) Western blot analyses for HES5, HES1, SOX9 and β-actin using protein lysates from WT limb buds at E10.5 and E11.5. Numbers represent the fold change in protein abundance as compared to E10.5 samples for the representative blot.

