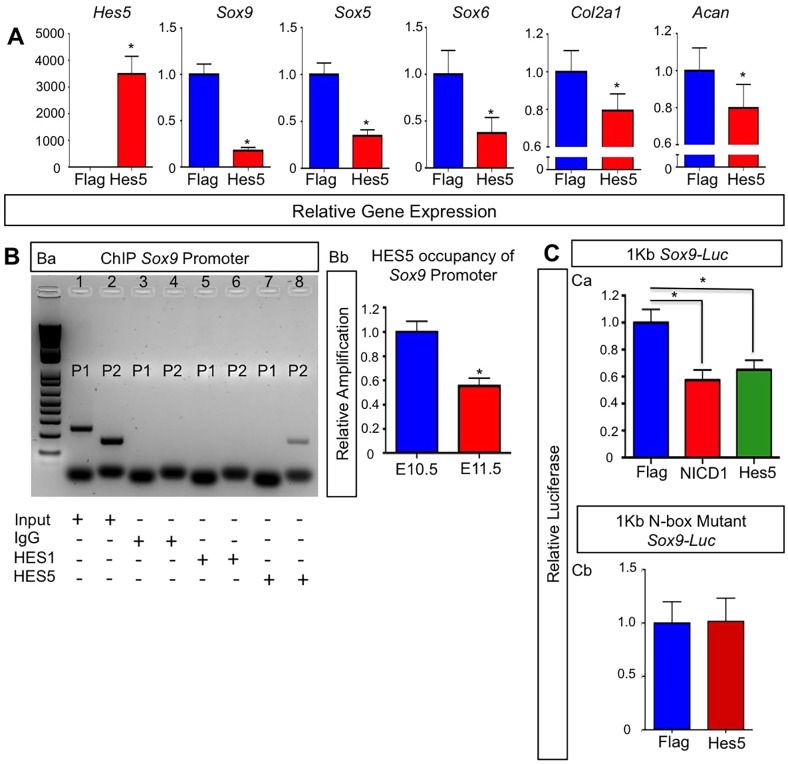
Fig. 6.
HES5 inhibits Sox9 expression through direct transcriptional regulation and is sufficient to delay chondrogenesis. (A) qPCR gene expression analyses for Hes5, Sox9, Sox5, Sox6, Col2a1 and Acan from RNA isolated from ATDC5 cultures at day 7. The y-axis represents relative gene expression normalized to that for β-actin then to Flag controls. Bars represent means±s.d. *P<0.05 (two-tailed Student's t-test). (B) ChIP analysis for input genomic DNA (positive control), IgG (negative control) pull down, HES1 pull down and HES5 pull down (Ba). Lane 1 shows input genomic DNA amplification using primer set 1 (P1). Lane 2 shows input genomic DNA amplification using primer set 2 (P2). Lane 3 shows no amplification using P1 primers with an IgG pull down. Lane 4 shows no amplification using P2 primers with an IgG pull down. Lane 5 shows no amplification using P1 primers with a HES1 pull down. Lane 6 shows no amplification using P2 primers with HES1 pull down. Lane 7 shows no amplification using P1 primers with HES5 pull down. Lane 8 shows amplification using P2 primers with a HES5 pull down. qPCR on DNA from the HES5 pulldown ChIP assay using limb buds at E10.5 and E11.5 (Bb). The y-axis is the relative amplification normalized to the input control then to the expression at E10.5. Bars represent means±s.d. *P<0.05 (two-tailed Student's t-test). (C) C3H10T1/2 cells or ATDC5 cells co-transfected with (Ca) a 1-kb Sox9-promoter-driven luciferase construct, Renilla plasmid and over expression plasmids for Flag, NICD1 or HES5, or (Cb) with a 1-kb Sox9-promoter-driven luciferase construct containing an N-box mutation, Renilla plasmid and over expression plasmids for Flag, NICD1 or HES5. The y-axis is relative luciferase activity normalized to Renilla then to the Flag control. Bars represent means±s.d. *P<0.05 (two-tailed Student's t-test).

