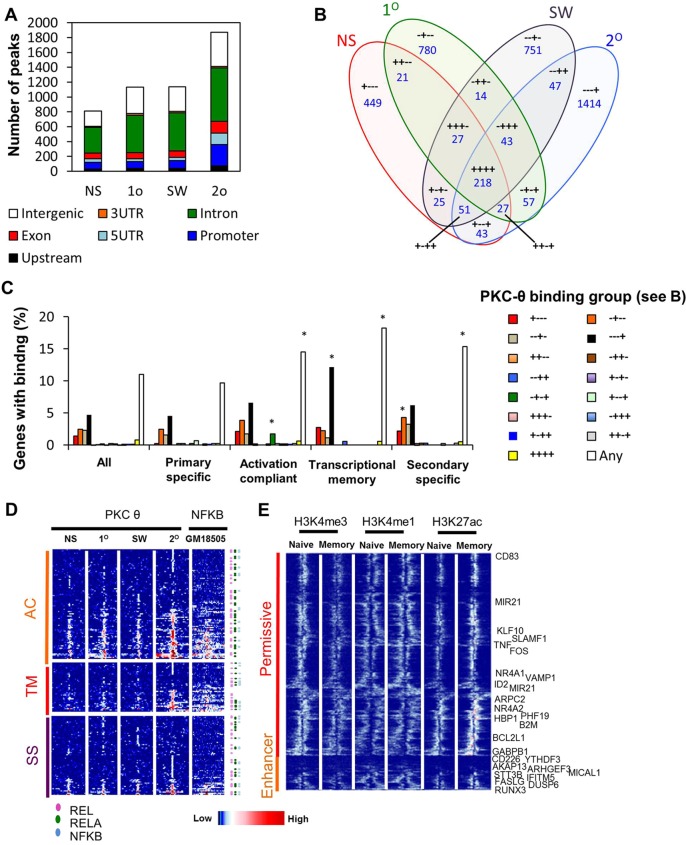
Fig. 3.
Inducible recruitment of nuclear PKC-θ in transcriptional memory-responsive Jurkat T cells. (A) PKC-θ ChIP-seq peaks in non-stimulated (NS) Jurkat T cells, and cells after primary stimulation (1°), stimulus withdrawal (SW), and secondary stimulation (2°) categorized into intergenic, 3′ untranslated region (UTR), intron, exon, 5′ UTR, promoter, and upstream regions as per their nearest ENSEMBL gene. (B) Overlap of ChIP-seq peaks in the different treatments. ‘+’ indicates PKC-θ peak present in treatment, the treatments are listed in order of non-stimulated, primary, stimulus withdrawal and secondary. (C) Proportion of genes from expression groups (see Fig. 1B), with PKC-θ binding in any treatment or in the treatment groups specified in B. *P≤0.05 (Fisher’s exact test against the proportion of all genes on the array). (D) Heatmap representation of PKC-θ enrichment levels for genes in the activation compliant (AC), transcriptional memory (TM) and secondary-specific (SS) groups. p65 ChIP-seq from GM18505 cells (GSM935282) is also shown. Sequencing tags are binned by 100 bp and shown ±3000 bp from the center of PKC-θ binding. NF-κB JASPAR motifs occurring within ±250 bp of the region center are annotated. (E) Overlap of PKC-θ binding in permissive and enhancer regions (re-stimulated Jurkat T cells, 2°) with previously published data on H3K4me3 (GSM772852) and H3K4me1 and H3K27me3 (GSE43119) enrichment in naive and memory CD4+ cells. Sequencing tags are binned by 100 bp and shown ±3000 bp from the center of PKC-θ binding. Binding near transcriptional memory and secondary-specific genes are labeled.

