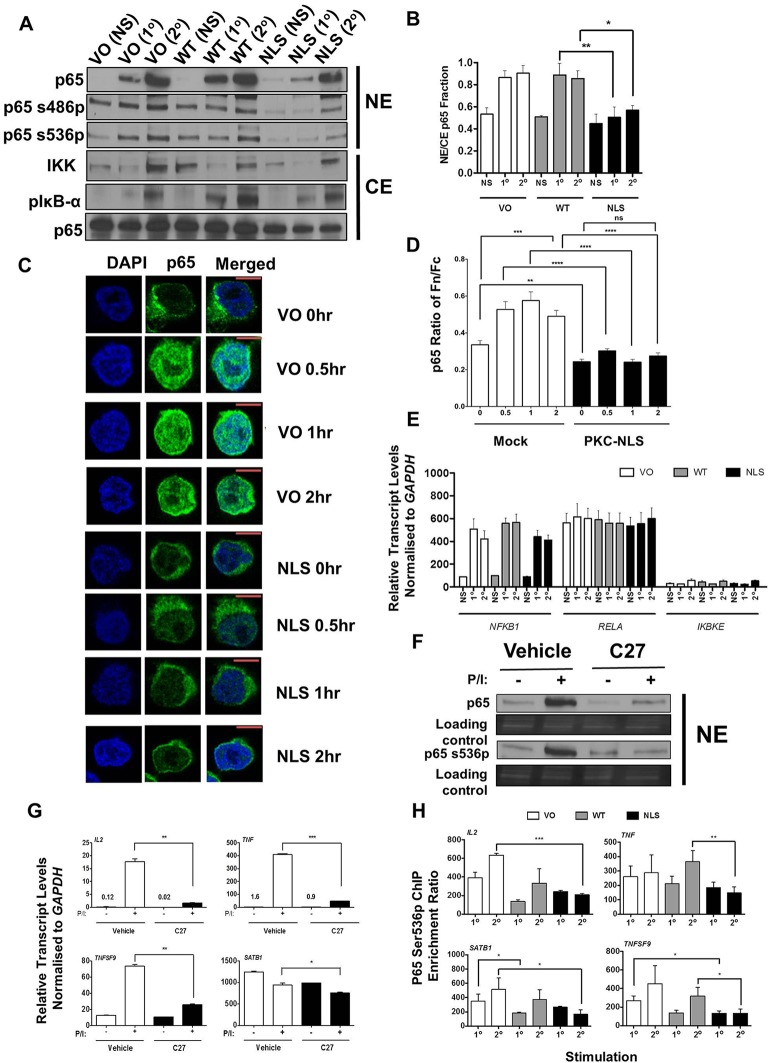
Fig. 6.
p65 Ser536 phosphorylation by nuclear PKC-θ. (A) Immunoblotting of p65, p65 phosphorylated at Ser486 (p65s486p) and Ser536 (p65s536p) in the nuclear extract (NE), and IKK, phosphorylated IκB-α on Ser32 or Ser36 (pIκB-α) and total p65 levels in the cytoplasmic extract (CE) in non-stimulated (NS) Jurkat T cells, and cells after primary (1°) and secondary (2°) stimulations transfected with vector only (VO), wild-type PKC-θ plasmid (WT) or cytoplasmic-restricted PKC-θ mutant (NLS) plasmids. Representative blot of three independent repeats (also see Fig. S4D,E). (B) Nuclear-to-cytoplasmic ratios (NE/CE) of p65 protein levels immunoblotted in nuclear versus cytoplasmic fractions was calculated for the cells described in A (mean±s.e.m., n=3). *P≤0.05, **P≤0.01 (two-way ANOVA). (C) Confocal microscopy of p65 nuclear localization during activation with PMA and Ca2+ ionophore for 0, 0.5, 1 and 2 h in Jurkat T cells transfected with vector only (VO) or the cytoplasm-restricted PKC-θ (NLS) mutant plasmids. Cells were stained with DAPI and anti-p65 antibodies. Representative images of these constructs. Scale bars: 20 μm. (D) Nuclear translocation of p65 (Fn/Fc) expressed as a ratio of nuclear (Fn) and cytoplasmic (Fc) fluorescence with background subtraction (mean±s.e.m., n>20 cells). **P≤0.01; ***P≤0.001; ****P<0.0001; ns, not significant (Mann–Whitney test). (E) Gene expression of p50 (NFKB1), p65 (RELA), and (IKBKE) in non-stimulated (NS) Jurkat T cells, and cells after primary (1°) and secondary (2°) stimulations transfected with VO, WT and NLS plasmids (mean±s.e.m., n=2). (F) Immunoblotting of p65 and p65 phosphorylated serine 536 (p65 Ser536p) levels in nuclear extract from DMSO or 1 μM C27-treated Jurkat T cells with or without PMA and Ca2+ ionophore (P/I) (n=6). (G) GAPDH-normalized gene expression of IL2, TNF, TNFSF9 and SATB1 in the vehicle-control or 1 μM C27-treated Jurkat T cells with or without PMA and Ca2+ ionophore (P/I) (mean±s.e.m., n=3). *P≤0.05, **P≤0.01, ***P≤0.001 (one-tailed Student's t-test). (H) ChIP-PCR analysis of p65 Ser536p at the promoters of IL2, TNF, TNFSF9 and an intronic region of SATB1 in Jurkat T cells expressing VO, WT and NLS plasmids after primary (1°) and secondary (2°) stimulations. ChIP enrichment ratio relative to the no-antibody control is shown (mean±s.e.m., n=3). *P≤0.05, **P≤0.01, ***P≤0.001 (one-tailed Student's t-test).

