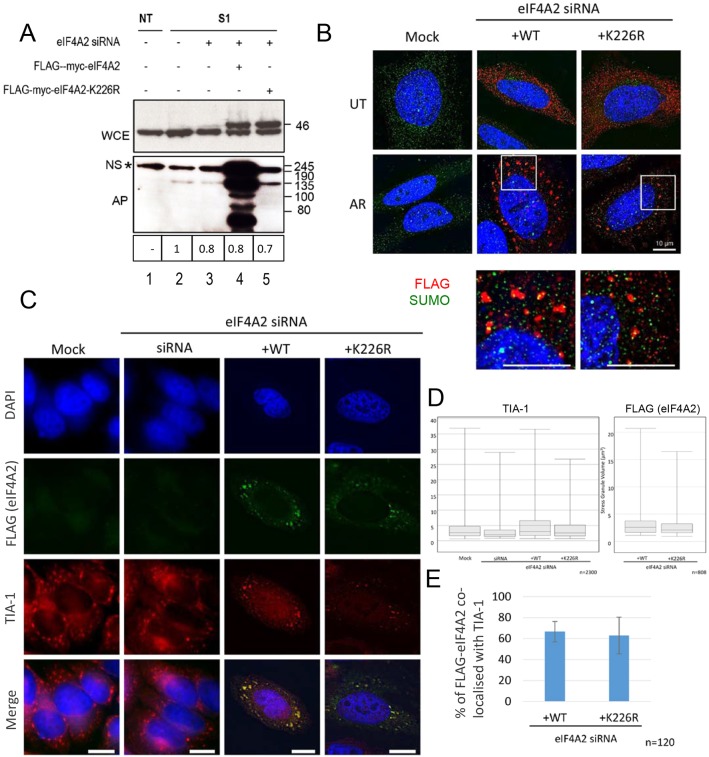
Fig. 6.
Mutation of K226 results in loss of sumoylation of eIF4A2 in vivo and a reduction in stress granule size. (A) His–SUMO1 stably transfected cells were reverse transfected with eIF4A2 siRNA (lanes 3–5). After 48 h, cells were mock treated (lane 2) or transfected with FLAG–myc–eIF4A2 wt or FLAG–myc–eIF4A2-K226R mutant as indicated. His-SUMO1 was purified from non-transfected cells (NT, lane 1) or His–SUMO1 stably transfected cells (S1, lanes 2–5) using Ni2+ agarose under denaturing conditions as in Figs 1 and 2. Proteins were analysed by SDS-PAGE and western blotted with anti-eIF4A2 antisera. (B) HeLa cells were depleted of endogenous eIF4A2 and transfected with either FLAG–myc–eIF4A2 wt or FLAG–myc–eIF4A2-K226 and either left untreated (UT) or treated with 1 mM arsenite (AR) for 30 min. Cells were immunostained with an anti-FLAG antibody and anti-SUMO. High-resolution images (lower panels) were taken over a z-plane of 4 μm at 0.05 μm slices. Scale bars: 10 μm. (C) HeLa cells were prepared as in B and immunostained for FLAG (eIF4A2) and TIA-1. Scale bars: 10 μm. (D) High-resolution z-stack images were taken and deconvolved using Huygens deconvolution software. Images were three-dimensionally rendered using the IMARIS software suite. 3D images were used to calculate the volumes of stress granules for both TIA-1 and FLAG (eIF4A2). Box-and-whisker plots were used to show the distribution of stress granule volumes. The box represents the 25–75th percentiles, and the median is indicated. The whiskers show the 10–90th percentiles. n=2300 for TIA-1 and 800 for FLAG. (E) Cells processed as in C were analysed for colocalisation of FLAG and TIA-1 signals. The chart shows the percentage of FLAG (eIF4A2) signal that overlaps with TIA-1 in cells transfected with either FLAG-eIF4A2 WT or the K226R mutant (mean±s.d., n=120).

