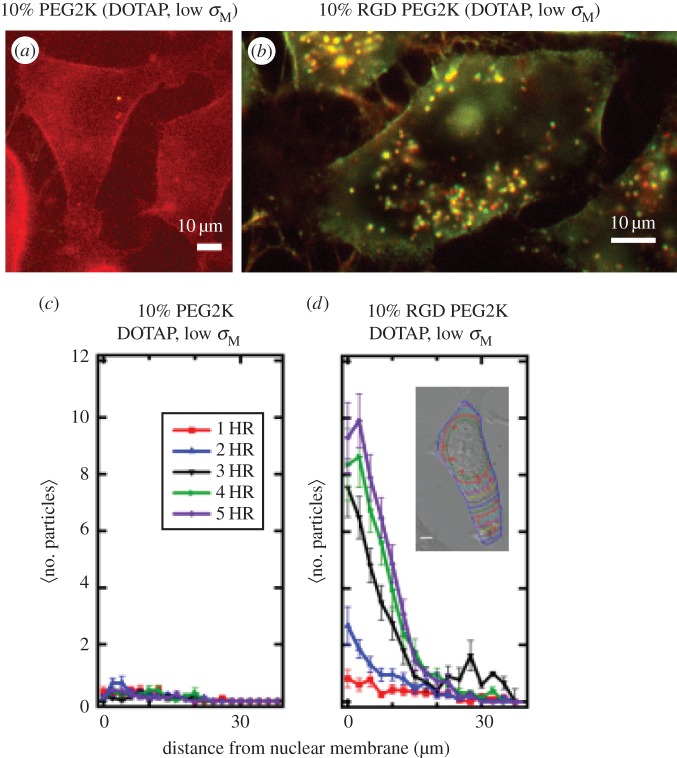
Figure 4.
Live-cell imaging results of PEGylated and RGD-PEGylated CL–DNA nanoparticles (NPs) contrasting non-specific and specific uptake (a,b). Fluorescent images of low-σM DOTAP/DOPC (30/60, mol/mol)–DNA complexes with 10 mol% of either PEG2K-lipid (a) or RGD-PEG2K-lipid (b). Images at 5 h after NP addition (dual channel (Cy5-DNA (670 nm emission), TRITC-lipid (580 nm emission)) fluorescence; complexes at ρchg=molar charge ratio of lipid to DNA=10; mouse L-cells). These images at low membrane charge density (σM=0.005 e Å−2) show a dramatic increase in complex uptake when a linear RGD peptide targeting cell integrins is attached to the distal end of PEG2K (cf. a with b). Scale bars in (a,b) are 10 μm. (c,d) Quantitative particle tracking results of (a,b), averaged over 20 cells. The data show the intracellular distribution of NPs as a function of distance from the nucleus for 1 h through 5 h after NP addition. Low-σM PEG2K-coated complexes show ≈no uptake (c; cf. with a), while low-σM RGD-PEG2K-coated complexes are taken up soon after addition (d; cf. with b). (Inset to d) Contour lines in a typical cell show the boundaries used to define distance from nuclear membrane. Adapted from [61] with permission from Elsevier.

