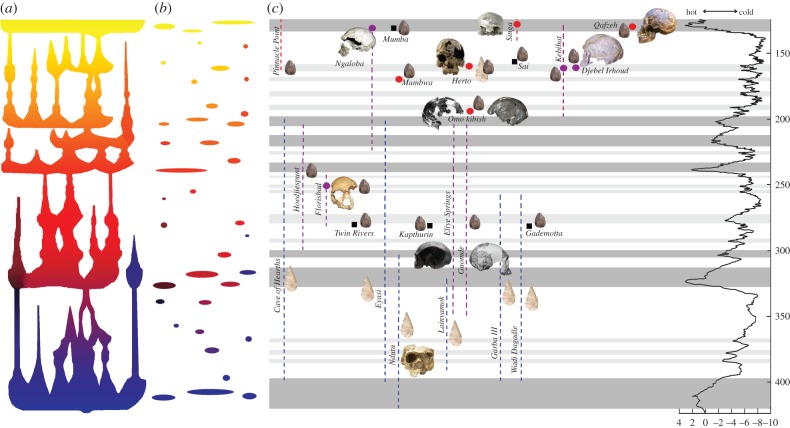
Figure 2.
(a) Cartoon of the complex phylogenetic pattern through time, shaped by repeated expansions, extinctions and assimilations; (b) geographical expression of a complex phylogenetic pattern in the fossil and archaeological records; (c) distribution of key fossil specimens and archaeological sites in Africa between 400 and 130 ka in the context of climate change. In (c), blue lines represent fossils of Homo heidelbergensis, purple lines and circles fossils of Homo helmei and red lines and circles fossils of Homo sapiens. Archaeological sites are represented by black squares, Acheulean industries by a hand-axe, and Middle Stone Age industries by a Levallois point.

