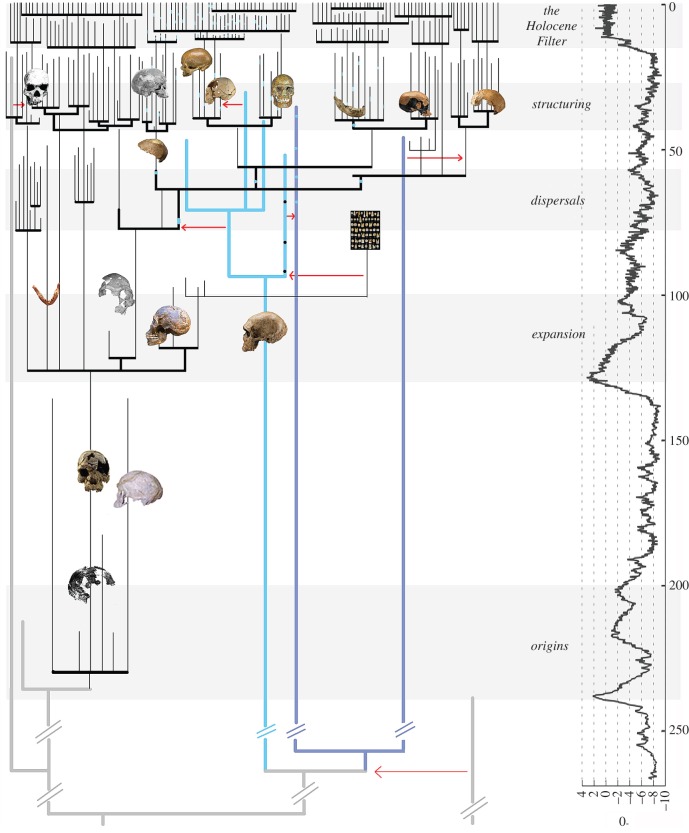
Figure 3.
Schematic of the five transitions in the evolutionary history of Homo sapiens. Dark blue lines represent Denisovans, light blue lines Neanderthals and grey/black lines modern humans. Red arrows represent events of interspecific admixture. To the right, climate variation (x axis) based on oxygen isotope data through time (y axis).

