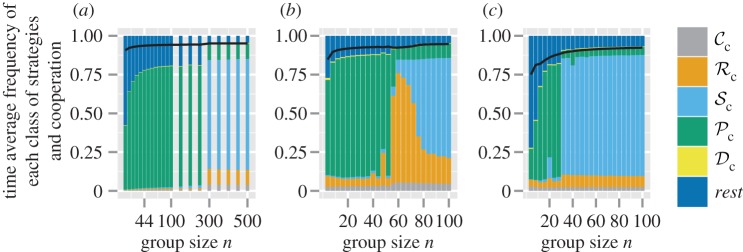
Figure 3.
Time average frequency (over 106 generations) of the frequency of cooperation (black line) and the six classes of strategies (


 , and rest) plotted as a function of group size n. Parameter values: Bh = 2, Ch = 1, Dp = 2, Cp = 1, T = 30, μ = 0.01, d = 250. Panel specific parameters: C1 = 1, z = T (a), C1=1, z = 5 (b), C1 = 0, z = 5 (c).

