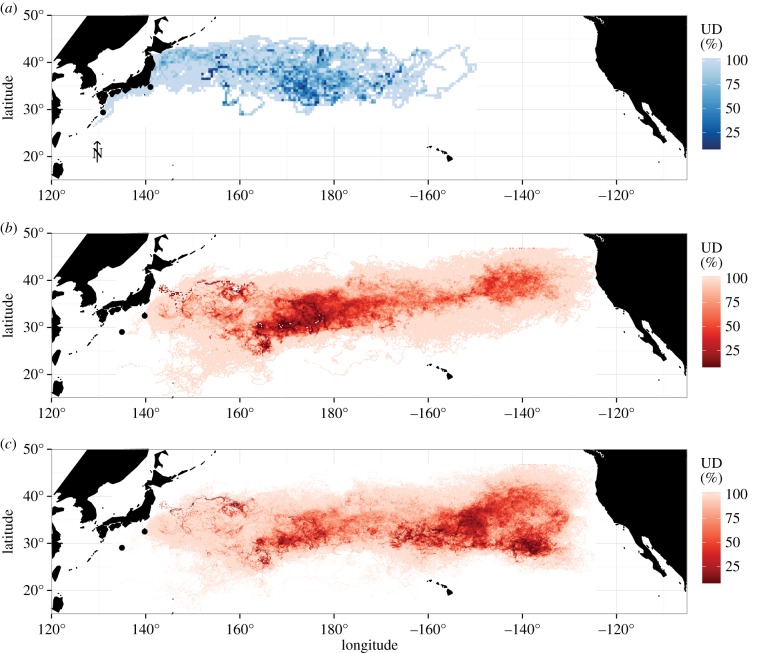
Figure 1.
(a) Spatial distribution of 44 satellite deployed loggerhead tracks from 2010 to 2013. Probability of an animal within a given cell (utilization distribution, UD) ranges from 0 to 100. The two main deploy locations are shown with black dots. Spatial distribution (UD) of 6000 simulated particles, released at the same date per region as observed turtles. Release dates centred around actual turtle deploys. Simulations ran for (b) 0–865 days (equal to the maximum number of turtle tracking days) and for long-term comparison, (c) 0–1460 days (4 years). Release locations are shown with grey dots.

