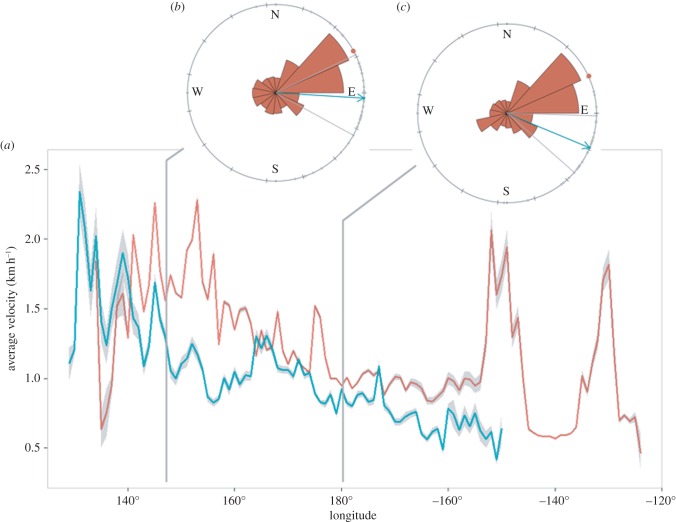
Figure 2.
(a) Average speed by degree longitude for turtle tracks (blue) and particles (red) and 95% confidence intervals (grey). Directional diagrams of animal movement and particle drift upon entering (b) the Kuroshio Extension Bifurcation Region (KEBR) at 155°E and (c) transitioning to the North Pacific Current at 180°. Average directional heading of turtles (grey dots) with grand mean average (blue arrow) are compared with the average directional heading of particles transported by currents (red wind rose) with grand mean average (red dot).

