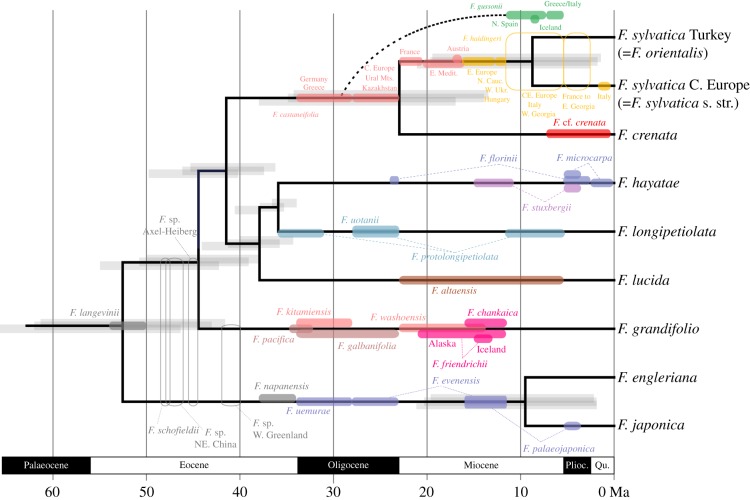
Figure 2.
A chronogram for Fagus inferred with fossilized birth death (FBD) dating and 53 fossil taxa obtained with the randomly drawn ages from within each fossil's stratigraphic age interval (electronic supplementary material, table S3). The right-most grey bars at nodes show the highest posterior density (HPD) intervals obtained with the youngest stratigraphic ages, the left-most grey bars, the HPDs obtained with the oldest stratigraphic ages and the middle grey bars, the HPDs obtained with random fossil ages. The coloured bars and dotted lines represent the chronological distribution of the respective fossil based on the palaeobotanical studies cites in electronic supplementary material, table S3 and take into account the divergence times inferred under the FBD model; the raw BEAST2 output is shown in electronic supplementary material, figure S2. Plioc., Pliocene; Qu., Quaternary (Pleistocene, Holocene).

