
Figure 5.
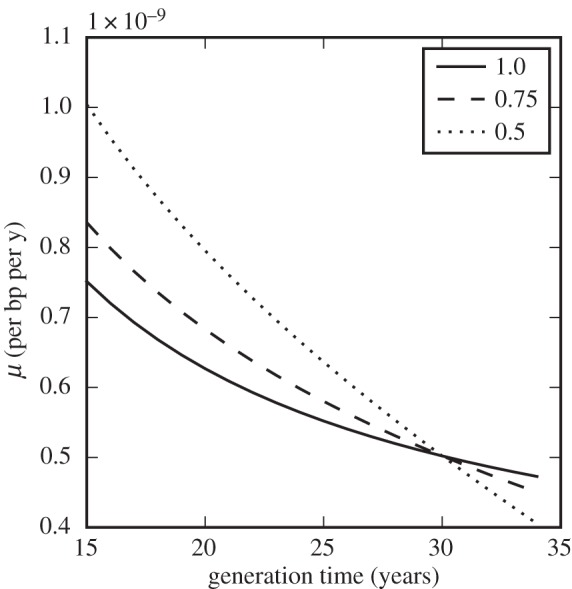
Models of human mutation rate slowdown in which the seminiferous epithelial cycle time increases with generation time and age of puberty. Dotted line: cycle time is 0.5 times the present length when generation time is 15 years; dashed line: cycle time is 0.75 times the present length when generation time is 15 years; solid line: no change in cycle time (identical to the solid line in figure 1). Overall rates per basepairs are scaled to be 0.5×10⁻⁹ bp–1 yr–1 when tgen = 30 yr.