Figure 7.

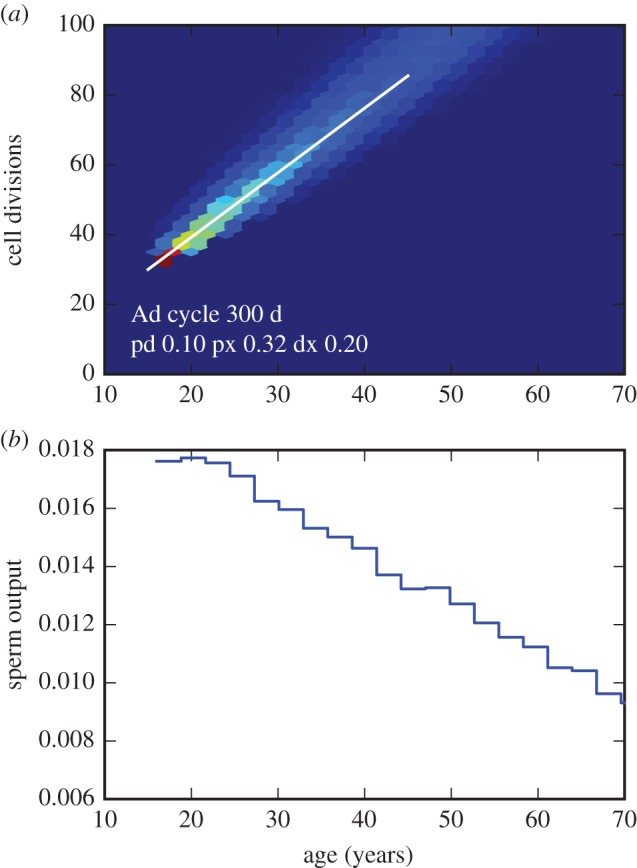
Output from an implementation of the model in figure 6, for parameters fitting the observed paternal age effect and decline in sperm production. (Code available upon request.) (a) Joint distribution of paternal age and number of cell divisions as the zygote in simulated spermatozoa (colours indicate relative frequency from zero (dark blue) to high (red)) for a set of parameters in which the Ad cycle time td = 300 days and initial transition times t0 were sampled uniformly from the range 5000–5500 days, P(Ap → Ad) = 0.1, P(Ap → X) = 0.32, P(Ad → X) = 0.2. The white line shows the slope of the paternal age effect observed in humans. (b) Simulated relative daily sperm output as a function of age.
