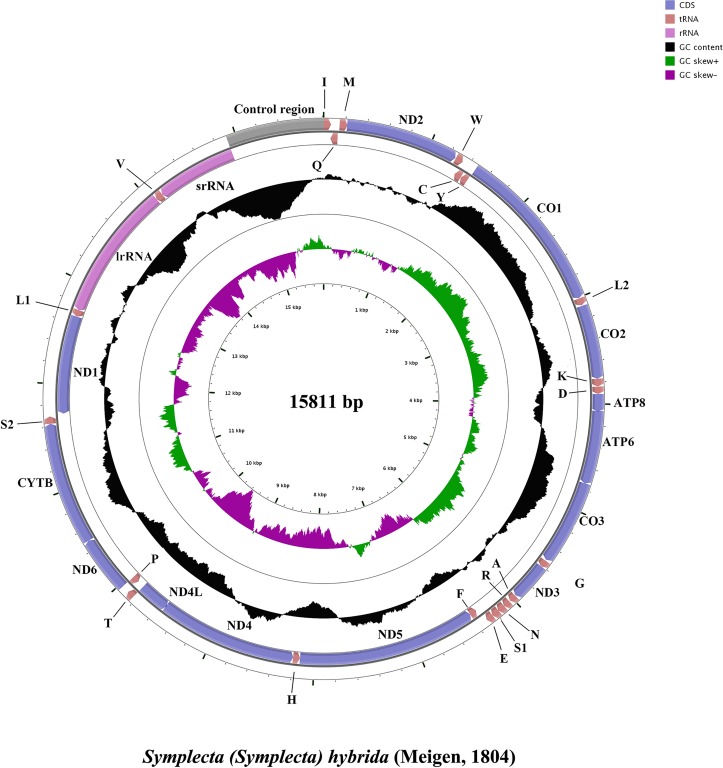
Fig 1. Mitochondrial map of Symplecta hybrida.
Circular maps were created using CGView [55]. The outermost circle shows the gene arrangement and comparison, and the arrows indicated the orientation of gene transcription. The tRNAs are abbreviated according to the IUPACIUB single-letter amino acid codes (S1: AGN; S2: UCN; L1: CUN; L2: UUR). The second circle (a black sliding circle) shows the GC content, as the deviation from the average GC content of the entire sequence. The third circle indicated the GC-skew, as the deviation from the average GC-skew of the entire sequence. The inner cycle indicated the size and the location of the genes.

