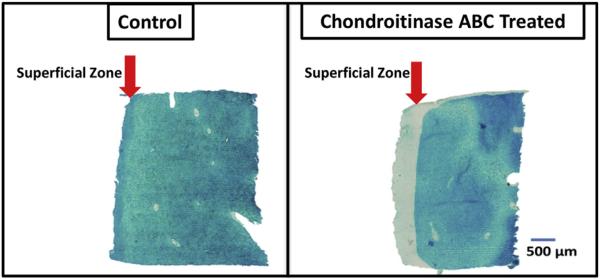
Fig. 2.
Representative light microscopy images of alcian blue stained control (left) and chondroitinase ABC treated (right) articular cartilage samples. The arrow indicates the superficial zone. As the fluid diffuses into the sample from the outer edges, digestion removes the proteoglycan from the superficial zone to the greatest extent. (For interpretation of the references to color in this figure legend, the reader is referred to the web version of this article.)

