Figure 6.

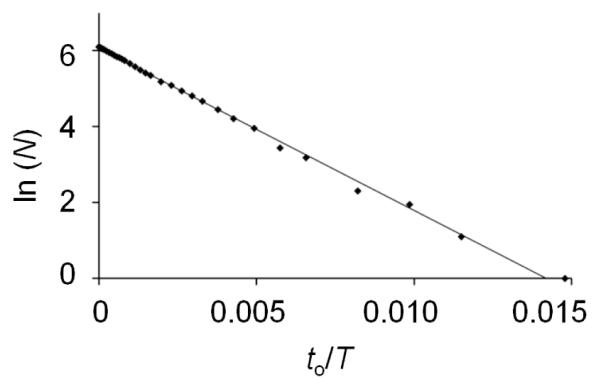
Plot of ln(N) vs. to/T from data described in Figure 2(b). Total observation time, T, was 60.85 s yielding 443 particle translocation events. The line is a linear regression fit to the data.

Plot of ln(N) vs. to/T from data described in Figure 2(b). Total observation time, T, was 60.85 s yielding 443 particle translocation events. The line is a linear regression fit to the data.