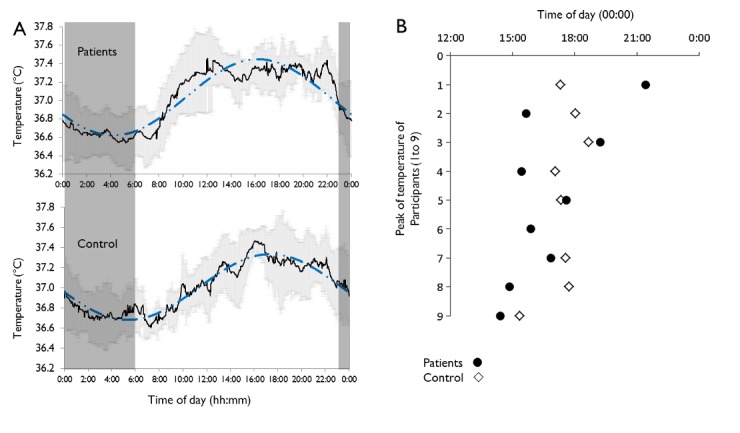
Fig 3. Body temperature rhythms and phase.

(A) Circadian rhythm of gastrointestinal temperature: Mean values (-) and SD (grey line) recorded every 60 s is shown for Patients (upper panel) and Controls (lower panel). The dashed blue lines represent modeling using the COSINOR method. Dark frame represents the sleeping period in the laboratory. (B) Individual acrophases of temperature in Controls (◇) and Patients (●). The 6th control participant was removed from the analyses. The F-test revealed a larger variability (p<0.05) in the time of acrophase in Patients compared to Controls.
